Office Depot 2009 Annual Report Download - page 27
Download and view the complete annual report
Please find page 27 of the 2009 Office Depot annual report below. You can navigate through the pages in the report by either clicking on the pages listed below, or by using the keyword search tool below to find specific information within the annual report.-
 1
1 -
2
-
3
-
4
-
5
-
6
-
7
-
8
-
9
-
10
-
11
-
12
-
13
-
14
-
15
-
16
-
 17
17 -
 18
18 -
 19
19 -
 20
20 -
 21
21 -
 22
22 -
 23
23 -
 24
24 -
 25
25 -
 26
26 -
 27
27 -
 28
28 -
 29
29 -
 30
30 -
 31
31 -
 32
32 -
 33
33 -
 34
34 -
 35
35 -
 36
36 -
 37
37 -
38
-
39
-
40
-
41
-
42
-
43
-
44
-
45
-
46
-
47
-
48
-
49
-
50
-
51
-
52
-
53
-
54
-
55
-
56
-
57
-
58
-
59
-
60
-
61
-
62
-
63
-
64
-
65
-
66
-
67
-
68
-
69
-
70
-
71
-
72
-
73
-
74
-
75
-
76
-
77
-
78
-
79
-
80
-
81
-
82
-
83
-
84
-
85
-
86
-
87
-
88
-
89
-
90
-
91
-
92
-
93
-
94
-
95
 |
 |

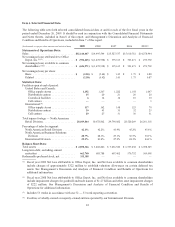
The increase in Division operating profit for 2009 was driven by lower asset impairments, an improvement in
product margins and lower operating expenses. The improvement in product margins was driven primarily by a
more favorable product mix, lower levels of inventory shrinkage and valuation charges as well as lower product
costs. These product margin improvements were partially offset by the deleveraging of fixed property costs on
lower sales levels. During 2008, we recorded fixed asset impairment charges of approximately $98 million. Store
impairment charges in 2009 totaled $3 million. Additionally, as a result of the 2008 fixed asset impairments, we
experienced lower levels of depreciation expense. During 2009, we closed underperforming stores as part of the
strategic review initiated during the fourth quarter of 2008 contributing to the increase in Division operating
profit in 2009. Operating expenses, including distribution costs and payroll and advertising expenses were down
in both 2008 and 2009. In addition to the fixed asset impairment charges, the operating loss in 2008 included
increased levels of inventory shrink compared to 2007. Division operating profit in both 2008 and 2009 was
negatively impacted by the unfavorable impact our sales volume decline had on gross margin and operating
expenses (the “flow through” impact).
At the end of 2009, we operated 1,152 retail stores in the U.S. and Canada. We opened six new stores during
2009 and 59 stores during 2008. During 2009, we closed 121 stores in North America, of which 120 were part of
the strategic review initiated during the fourth quarter of 2008. We anticipate opening approximately 20 stores in
2010. Also, we will continue to review locations as leases become due and will close or relocate stores when
appropriate.
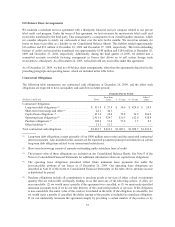
NORTH AMERICAN BUSINESS SOLUTIONS DIVISION
(Dollars in millions) 2009 2008 2007
Sales ........................................ $ 3,483.7 $ 4,142.1 $ 4,518.4
% change ..................................... (16)% (8)% (1)%
Division operating profit ......................... $ 98.2 $ 119.8 $ 220.1
% of sales .................................... 2.8% 2.9% 4.9%
Sales in our North American Business Solutions Division decreased 16% in 2009 and 8% in 2008. The sales
declines in both 2009 and 2008 reflect the impact of challenging economic conditions. The 2009 decline was
principally driven by a decrease in the number of customer transactions, which resulted in part from aggressive
pricing from some of our competitors in our large, national accounts and contraction in our public sector
business. On a product category basis, the Division experienced weakness in durables such as furniture,
technology and peripherals, as customers delayed their purchases of these products in favor of consumables like
paper, ink and toner.
Division operating profit totaled $98 million in 2009, compared to $120 million in 2008. This measure of
operating performance is consistent with the internal reporting of results used to manage the business and
allocate resources and does not include charges associated with the strategic decisions made as part of the
internal review initiated during the fourth quarter of 2008. Please see Charges discussion in the “Corporate and
Other” section of MD&A.
The decrease in Division operating profit in 2009 was driven by the flow through impact of lower sales levels as
well as lower product margins, reflecting a less profitable product mix and cost increases that could not be passed
on to our customers. Division operating profit for 2009 also reflects increased promotions in our direct business
during the first half of the year. These negative impacts were partially offset by reductions in operating expenses,
including a decrease in distribution costs as well as lower payroll and advertising expenses. The decrease in
Division operating profit in 2008 resulted primarily from the flow through impact of lower sales levels, an
increased accrual for bad debts consistent with the economic downturn and higher costs related to advertising and
professional fees.
25