Office Depot 2009 Annual Report Download - page 42
Download and view the complete annual report
Please find page 42 of the 2009 Office Depot annual report below. You can navigate through the pages in the report by either clicking on the pages listed below, or by using the keyword search tool below to find specific information within the annual report.-
 1
1 -
2
-
3
-
4
-
5
-
6
-
7
-
8
-
9
-
10
-
11
-
12
-
13
-
14
-
15
-
16
-
17
-
18
-
19
-
20
-
21
-
22
-
23
-
24
-
25
-
26
-
27
-
28
-
29
-
30
-
31
-
 32
32 -
 33
33 -
 34
34 -
 35
35 -
 36
36 -
 37
37 -
 38
38 -
 39
39 -
 40
40 -
 41
41 -
 42
42 -
 43
43 -
 44
44 -
 45
45 -
 46
46 -
 47
47 -
 48
48 -
 49
49 -
 50
50 -
 51
51 -
 52
52 -
53
-
54
-
55
-
56
-
57
-
58
-
59
-
60
-
61
-
62
-
63
-
64
-
65
-
66
-
67
-
68
-
69
-
70
-
71
-
72
-
73
-
74
-
75
-
76
-
77
-
78
-
79
-
80
-
81
-
82
-
83
-
84
-
85
-
86
-
87
-
88
-
89
-
90
-
91
-
92
-
93
-
94
-
95
 |
 |

Economic Factors — Our customers in the North American Retail Division and many of our customers in the
North American Business Solutions Division are predominantly small and home office businesses. Accordingly,
these customers may continue to curtail their spending in reaction to macroeconomic conditions, such as changes
in the housing market and commodity costs, higher credit costs, credit availability and other factors. The
downturn in the global economy experienced over the past two years negatively impacted our sales and profits.
Liquidity Factors — Historically, we have generated positive cash flow from operating activities and have had
access to broad financial markets that provide the liquidity we need to operate our business. Together, these
sources have been used to fund operating and working capital needs, as well as invest in business expansion
through new store openings, capital improvements and acquisitions. However, due to the downturn in the global
economy our operating results have diminished. In June 2009, we issued $350 million of redeemable preferred
stock and in September 2008, we entered into a $1.25 billion asset based credit facility to provide liquidity.
Continued distress in the financial markets has resulted in significant volatility in the capital markets and
diminished liquidity and credit availability. There can be no assurance that our liquidity will not be adversely
impacted by changes in the financial markets and the global economy. In addition, deterioration in our financial
results could negatively impact our credit ratings. The tightening of the credit markets or a downgrade in our
credit ratings could make it more difficult for us to access funds, to refinance our existing indebtedness, to enter
into agreements for new indebtedness or to obtain funding through the issuance of securities.
MARKET SENSITIVE RISKS AND POSITIONS
The company has adopted an enterprise risk management process patterned after the principles set out by the
Committee of Sponsoring Organizations (COSO) in 2004. Management utilizes a common view of exposure
identification and risk management. A process is in place for periodic risk reviews and identification of
appropriate mitigation strategies.
We have market risk exposure related to interest rates and foreign currency exchange rates. Market risk is
measured as the potential negative impact on earnings, cash flows or fair values resulting from a hypothetical
change in interest rates or foreign currency exchange rates over the next year. Interest rate changes on obligations
may result from external market factors, as well as changes in our credit rating. We manage our exposure to
market risks at the corporate level. The portfolio of interest-sensitive assets and liabilities is monitored and
adjusted to provide liquidity necessary to satisfy anticipated short-term needs. Our risk management policies
allow the use of specified financial instruments for hedging purposes only; speculation on interest rates or foreign
currency rates is not permitted.
Interest Rate Risk
We are exposed to the impact of interest rate changes on cash equivalents and debt obligations. The impact on
cash and short-term investments held at the end of 2009 from a hypothetical 10% decrease in interest rates would
be a decrease in interest income of less than $1 million.
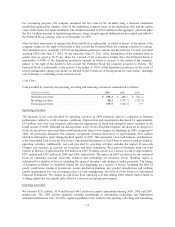
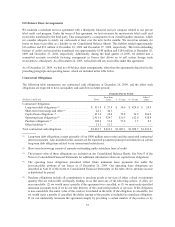
Market risk associated with our debt portfolio is summarized below:
2009 2008
(Dollars in thousands)
Carrying
Value
Fair
Value
Risk
Sensitivity
Carrying
Value
Fair
Value
Risk
Sensitivity
$400 million senior notes ......... $ 400,172 $ 345,966 $ 5,420 $ 400,278 $ 206,000 $ 8,380
Asset based credit arrangement .... $—$—$—$ 139,098 $ 139,098 $ 696
The risk sensitivity of fixed rate debt reflects the estimated increase in fair value from a 50 basis point decrease
in interest rates, calculated on a discounted cash flow basis. The sensitivity of variable rate debt reflects the
possible increase in interest expense during the next period from a 50 basis point change in interest rates
prevailing at year-end.
40