Office Depot 2009 Annual Report Download - page 35
Download and view the complete annual report
Please find page 35 of the 2009 Office Depot annual report below. You can navigate through the pages in the report by either clicking on the pages listed below, or by using the keyword search tool below to find specific information within the annual report.-
 1
1 -
2
-
3
-
4
-
5
-
6
-
7
-
8
-
9
-
10
-
11
-
12
-
13
-
14
-
15
-
16
-
17
-
18
-
19
-
20
-
21
-
22
-
23
-
24
-
 25
25 -
 26
26 -
 27
27 -
 28
28 -
 29
29 -
 30
30 -
 31
31 -
 32
32 -
 33
33 -
 34
34 -
 35
35 -
 36
36 -
 37
37 -
 38
38 -
 39
39 -
 40
40 -
 41
41 -
 42
42 -
 43
43 -
 44
44 -
 45
45 -
46
-
47
-
48
-
49
-
50
-
51
-
52
-
53
-
54
-
55
-
56
-
57
-
58
-
59
-
60
-
61
-
62
-
63
-
64
-
65
-
66
-
67
-
68
-
69
-
70
-
71
-
72
-
73
-
74
-
75
-
76
-
77
-
78
-
79
-
80
-
81
-
82
-
83
-
84
-
85
-
86
-
87
-
88
-
89
-
90
-
91
-
92
-
93
-
94
-
95
 |
 |

For accounting purposes, the company measured the fair value of the dividend using a binomial simulation
model that captured the intrinsic value of the underlying common stock on the declaration date and the option
value of the shares and future dividends. The dividend resulted in $30.5 million in the aggregate, which includes
the $18.1 million increase in liquidation preference, being charged against additional paid-in capital and added to
the Preferred Stock carrying value as of December 26, 2009.
After the third anniversary of issuance the Preferred Stock is redeemable, in whole or in part, at the option of the
company, subject to the right of the holder to first convert the Preferred Stock the company proposes to redeem.
The redemption price is initially 107% of the liquidation preference amount and decreases by 1% each year until
reaching 100% after June 23, 2019. At any time after June 23, 2011, if the closing price of the common stock is
greater than or equal to $9.75 per share for a period of 20 consecutive trading days, the Preferred Stock is
redeemable at 100% of the liquidation preference amount, in whole or in part, at the option of the company,
subject to the right of the holder to first convert the Preferred Stock the company proposes to redeem. The
Preferred Stock is redeemable at the option of the holder at 101% of the liquidation preference in the event of
certain fundamental change provisions (as defined in the Certificate of Designations for each series), including
sale, bankruptcy, or delisting of our common stock.
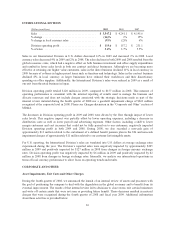
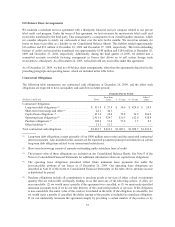
Cash Flows
Cash provided by (used in) our operating, investing and financing activities is summarized as follows:
(Dollars in millions) 2009 2008 2007
Operating activities .............................. $ 296.4 $ 468.3 $ 411.4
Investing activities ............................... 25.3 (338.7) (372.5)
Financing activities .............................. 173.3 (186.3) 7.9
Operating Activities
The decrease in net cash provided by operating activities in 2009 primarily reflects a reduction in business
performance related to weak economic conditions. Depreciation and amortization decreased by approximately
$30 million year over year primarily reflecting the impairment of fixed and intangible assets recorded in the
fourth quarter of 2008. Although we did experience lower levels of bad debt expense, the decrease in charges for
losses on inventories and receivables resulted primarily from lower charges for shrinkage in 2009, compared to
2008. As previously discussed, the company recognized valuation allowances of approximately $322 million
related to deferred tax assets during the third quarter of 2009. This represents a non-cash expense, and therefore,
it has been added back to our net loss in the Consolidated Statements of Cash Flows to arrive at cash provided by
operating activities. Additionally, net cash provided by operating activities includes the impact of non-cash
Charges and increases in accruals for severance and lease obligations. We received dividends from our joint
venture in Mexico of approximately $14 million in 2009. Working capital was a source of cash of approximately
$207 million and $187 million in 2009 and 2008, respectively. The source in 2009 was driven by our continued
focus on collecting accounts receivable balances and controlling our inventory levels. Working capital is
influenced by a number of factors, including the aging of inventory and timing of vendor payments. The timing
of payments is subject to variability during the year depending on a variety of factors, including the flow of
goods, credit terms, timing of promotions, vendor production planning, new product introductions and working
capital management. For our accounting policy on cash management, see Note A of the Notes to Consolidated
Financial Statements. The change in cash flows from operating activities during 2008 reflects improvement in
working capital that was significantly offset by a decrease in business performance.
Investing Activities
We invested $131 million, $330 million and $461 million in capital expenditures during 2009, 2008 and 2007,
respectively. The 2009 activity primarily includes investments in information technology and distribution
network infrastructure costs. In 2008, capital expenditures also related to the opening, relocating and remodeling
33