Office Depot 2009 Annual Report Download - page 30
Download and view the complete annual report
Please find page 30 of the 2009 Office Depot annual report below. You can navigate through the pages in the report by either clicking on the pages listed below, or by using the keyword search tool below to find specific information within the annual report.-
 1
1 -
2
-
3
-
4
-
5
-
6
-
7
-
8
-
9
-
10
-
11
-
12
-
13
-
14
-
15
-
16
-
17
-
18
-
19
-
 20
20 -
 21
21 -
 22
22 -
 23
23 -
 24
24 -
 25
25 -
 26
26 -
 27
27 -
 28
28 -
 29
29 -
 30
30 -
 31
31 -
 32
32 -
 33
33 -
 34
34 -
 35
35 -
 36
36 -
 37
37 -
 38
38 -
 39
39 -
 40
40 -
41
-
42
-
43
-
44
-
45
-
46
-
47
-
48
-
49
-
50
-
51
-
52
-
53
-
54
-
55
-
56
-
57
-
58
-
59
-
60
-
61
-
62
-
63
-
64
-
65
-
66
-
67
-
68
-
69
-
70
-
71
-
72
-
73
-
74
-
75
-
76
-
77
-
78
-
79
-
80
-
81
-
82
-
83
-
84
-
85
-
86
-
87
-
88
-
89
-
90
-
91
-
92
-
93
-
94
-
95
 |
 |

Charges related to these actions totaled approximately $57 million in 2009 and related primarily to lease
accruals, inventory write downs, severance expenses and other facility closure costs. The 2008 Charges under
these initiatives totaled approximately $22 million and consisted primarily of accelerated depreciation,
severance related costs and lease accruals.
•Asset Sales and Sale-Leaseback Transactions — As a result of the strategic review and to enhance liquidity,
we entered into multiple sale and sale-leaseback transactions. Total proceeds from these transactions were
approximately $150 million and are included in the investing section on our Consolidated Statement of Cash
Flows. Losses on these transactions are included in the Charges and totaled approximately $22 million in
2009. Gains have been deferred and will reduce rent expense over the related leaseback periods. One
transaction was the sale of an asset previously classified as a capital lease. Payments to satisfy the existing
capital lease obligation are included in the financing section of the Consolidated Statement of Cash Flows. An
additional sale-leaseback arrangement associated with operating properties included provisions that resulted in
the transaction being accounted for as a financing. Accordingly, approximately $19 million has been included
in long-term debt on the Consolidated Balance Sheet at December 26, 2009.
•Headcount Reductions and Other Restructuring Activities — Each of the Divisions, as well as Corporate
eliminated positions in an effort to centralize activities and eliminate geographic redundancies. Total severance
and termination benefit costs associated with these actions totaled approximately $22 million and $13 million
during 2009 and 2008, respectively. During 2009, we also recorded Charges for contract terminations on
certain leased assets totaling approximately $17 million and for other restructuring activities totaling
approximately $7 million. Additionally, we recognized a non-cash loss of approximately $6 million in
conjunction with the disposition of other assets during 2009. Charges for other restructuring activities in 2008
totaled approximately $60 million and related primarily to asset write downs and costs associated with the
restructuring of our back office operations and call centers in Europe.
The Charges recognized in 2007 totaled $40 million and related primarily to the consolidation of warehouses and
distribution centers in North America and Europe as well as management restructuring and call center
consolidation in Europe.
In addition to the Charges that relate to the strategic reviews, during 2008, we recognized other material charges
because of the downturn in our business. Those charges include material asset impairments relating to stores we
continue to operate, charges to impair amortizing customer relationship intangible assets, as well as an increase
in our allowance for bad debts related to our private label credit card portfolio and certain other accounts
receivable balances to reflect the economic downturn. As these charges are considered reflective of operating an
ongoing business in difficult times, they were included in the 2008 Division operating results.
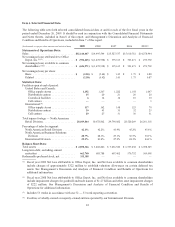
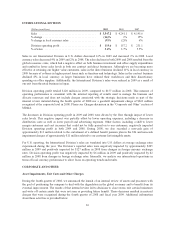
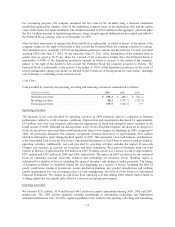
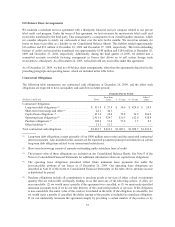
General and Administrative Expenses
Total general and administrative expenses (“G&A”) decreased from $743 million in 2008 to $723 million in
2009. The portion of G&A expenses considered directly or closely related to division activity is included in the
measurement of Division operating profit. The company continues to evaluate G&A and other expense allocation
across the Divisions and may refine methodologies in future periods. Other companies may charge more or less
G&A expenses and other costs to their segments, and our results therefore may not be comparable to similarly
titled measures used by other companies. The remainder of the total G&A expenses are considered corporate
expenses. A breakdown of G&A is provided in the following table:
(Dollars in millions) 2009 2008 2007
Division G&A ................................... $ 361.7 $ 394.6 $ 341.8
Corporate G&A .................................. 361.4 348.6 303.9
Total G&A .................................... $ 723.1 $ 743.2 $ 645.7
% of sales ....................................... 6.0% 5.1% 4.2%
28