Memorex 2013 Annual Report Download - page 82
Download and view the complete annual report
Please find page 82 of the 2013 Memorex annual report below. You can navigate through the pages in the report by either clicking on the pages listed below, or by using the keyword search tool below to find specific information within the annual report.-
 1
1 -
2
-
3
-
4
-
5
-
6
-
7
-
8
-
9
-
10
-
11
-
12
-
13
-
14
-
15
-
16
-
17
-
18
-
19
-
20
-
21
-
22
-
23
-
24
-
25
-
26
-
27
-
28
-
29
-
30
-
31
-
32
-
33
-
34
-
35
-
36
-
37
-
38
-
39
-
40
-
41
-
42
-
43
-
44
-
45
-
46
-
47
-
48
-
49
-
50
-
51
-
52
-
53
-
54
-
55
-
56
-
57
-
58
-
59
-
60
-
61
-
62
-
63
-
64
-
65
-
66
-
67
-
68
-
69
-
70
-
71
-
 72
72 -
 73
73 -
 74
74 -
 75
75 -
 76
76 -
 77
77 -
 78
78 -
 79
79 -
 80
80 -
 81
81 -
 82
82 -
 83
83 -
 84
84 -
 85
85 -
 86
86 -
 87
87 -
 88
88 -
 89
89 -
 90
90 -
 91
91 -
 92
92 -
93
-
94
-
95
-
96
-
97
-
98
-
99
-
100
-
101
-
102
-
103
-
104
-
105
-
106
-
107
-
108
-
109
-
110
-
111
-
112
-
113
-
114
-
115
-
116
-
117
-
118
-
119
-
120
-
121
-
122
 |
 |

NOTES TO CONSOLIDATED FINANCIAL STATEMENTS — (Continued)
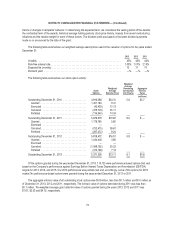
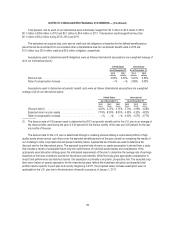
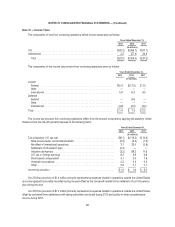
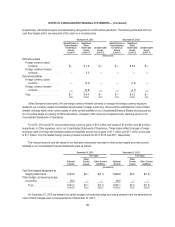
The plans’ asset allocations by asset category were as follows:
United States International
As of December 31, As of December 31,
2013 2012 2013 2012
Short-term investments ..................................... 1% 9% 1% 1%
Fixed income securities ..................................... 18% 19% 23% 40%
Equity securities .......................................... 63% 56% —% 26%
Absolute return strategy equity funds ........................... 18% 16% —% —%
Insurance contracts ........................................ —% —% 76% 33%
Total ................................................. 100% 100% 100% 100%
For the U.S. plan, we maintain target allocation percentages among various asset classes based on an investment
policy established for the plan, which is designed to achieve long-term objectives of return, while mitigating against downside
risk and considering expected cash flows. The current target asset allocation includes equity securities at 35 to 80 percent,
fixed income securities at 20 to 40 percent and other investments at 10 to 20 percent. Other investments include short-term
investments and absolute return strategy funds which are investments designed to achieve a certain return. Management
reviews our U.S. investment policy for the plan at least annually. Outside the U.S., the investment objectives are similar to the
U.S., subject to local regulations. In some countries, a higher percentage allocation to fixed income securities is required.
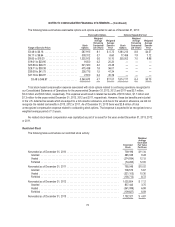
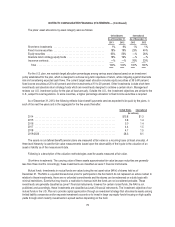
As of December 31, 2013, the following reflects future benefit payments services expected to be paid, by the plans, in
each of the next five years and in the aggregate for the five years thereafter:
United States International
(In millions)
2014 ........................................................... $15.8 $1.3
2015 ........................................................... 3.6 1.4
2016 ........................................................... 5.0 1.4
2017 ........................................................... 4.4 1.5
2018 ........................................................... 4.7 1.5
2019-2023 ....................................................... 26.3 8.1
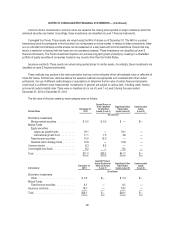
The assets in our defined benefit pension plans are measured at fair value on a recurring basis (at least annually). A
three-level hierarchy is used for fair value measurements based upon the observability of the inputs to the valuation of an
asset or liability as of the measurement date.
Following is a description of the valuation methodologies used for assets measured at fair value.
Short-term investments. The carrying value of these assets approximates fair value because maturities are generally
less than three months. Accordingly, these investments are classified as Level 1 financial instruments.
Mutual funds. Investments in mutual funds are valued using the net asset value (NAV) of shares held as of
December 31. The NAV is a quoted transactional price for participants in the fund which do not represent an active market. In
relation to these investments, there are no unfunded commitments and the shares can be redeemed on a daily basis with
minimal restrictions. Events that may lead to a restriction to transact with the funds are not considered probable. These
investments are generally classified as Level 1 financial instruments, however for certain mutual funds, the NAV is not
published, and accordingly, these investments are classified as Level 2 financial instruments. The investment objective of our
mutual funds in the U.S. Plan is to provide capital appreciation through an investment strategy that allocates its assets among
limited liability companies and/or separate investment accounts or to invest in large cap equity funds focusing on high quality
yields through short maturity investments in spread sectors depending on the fund.
79