Memorex 2013 Annual Report Download - page 39
Download and view the complete annual report
Please find page 39 of the 2013 Memorex annual report below. You can navigate through the pages in the report by either clicking on the pages listed below, or by using the keyword search tool below to find specific information within the annual report.-
 1
1 -
2
-
3
-
4
-
5
-
6
-
7
-
8
-
9
-
10
-
11
-
12
-
13
-
14
-
15
-
16
-
17
-
18
-
19
-
20
-
21
-
22
-
23
-
24
-
25
-
26
-
27
-
28
-
 29
29 -
 30
30 -
 31
31 -
 32
32 -
 33
33 -
 34
34 -
 35
35 -
 36
36 -
 37
37 -
 38
38 -
 39
39 -
 40
40 -
 41
41 -
 42
42 -
 43
43 -
 44
44 -
 45
45 -
 46
46 -
 47
47 -
 48
48 -
 49
49 -
50
-
51
-
52
-
53
-
54
-
55
-
56
-
57
-
58
-
59
-
60
-
61
-
62
-
63
-
64
-
65
-
66
-
67
-
68
-
69
-
70
-
71
-
72
-
73
-
74
-
75
-
76
-
77
-
78
-
79
-
80
-
81
-
82
-
83
-
84
-
85
-
86
-
87
-
88
-
89
-
90
-
91
-
92
-
93
-
94
-
95
-
96
-
97
-
98
-
99
-
100
-
101
-
102
-
103
-
104
-
105
-
106
-
107
-
108
-
109
-
110
-
111
-
112
-
113
-
114
-
115
-
116
-
117
-
118
-
119
-
120
-
121
-
122
 |
 |

gain. The 2012 operating loss in Corporate and Unallocated also included intangible asset impairment losses of $251.8 million
and a goodwill impairment loss of $23.3 million as discussed above. The 2011 operating loss in Corporate and Unallocated
also included a $7.0 million charge relating to the demolition of a previously closed facility during 2011.
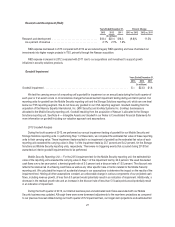
Financial Position
Our cash and cash equivalents balance as of December 31, 2013 was $132.6 million, an increase of $23.9 million from
$108.7 million as of December 31, 2012. The increase was driven by working capital and also included $10.1 million received
on the sale of land at a previously closed facility and a litigation settlement receipt of $2.5 million, partially offset by
restructuring payments of $19.4 million, capital expenditures of $7.0 million, share repurchases of $2.5 million and pension
contributions of $1.5 million.
Our accounts receivable balance as of December 31, 2013 was $163.3 million, a decrease of $57.5 million from
$220.8 million as of December 31, 2012 as a result of lower sales during the period. Days sales outstanding was 56 days as
of December 31, 2013, down 3 days from December 31, 2012. Days sales outstanding is calculated using the count-back
method, which calculates the number of days of most recent revenue that is reflected in the net accounts receivable balance.
Our inventory balance as of December 31, 2013 was $84.3 million, a decrease of $81.7 million from $166.0 million as of
December 31, 2012. Days of inventory supply was 61 days as of December 31, 2013, down 28 days from December 31, 2012
primarily due to our overall focus on reducing inventory levels, but particularly in our consumer electronics and accessories
inventory, as well as the sale of our consumer electronics businesses. Days of inventory supply is calculated using the current
period inventory balance divided by an estimate of the inventoriable portion of cost of goods sold expressed in days.
Our accounts payable balance as of December 31, 2013 was $94.7 million, a decrease of $68.0 million from
$162.7 million as of December 31, 2012. The decrease in accounts payable was mainly due to reduced purchases compared
to the previous year, as well as the timing of payments.
Liquidity and Capital Resources
We have various resources available to us for purposes of managing liquidity and capital needs, including our credit
facilities and letters of credit. Our primary sources of liquidity include cash flows generated by the sale of our products, our
cash and cash equivalents and credit capacity under our credit facilities. Our primary operating liquidity needs relate to our
working capital and funding our operations.
Cash and Cash Equivalents
Cash equivalents consist of highly liquid investments purchased with original maturities of three months or less.
Restricted cash that is related to contractual obligations or restricted by management is included in other assets on our
Consolidated Balance Sheets. No restricted cash was held at December 31, 2013. At December 31, 2012 restricted cash
primarily includes cash acquired from Nexsan that was previously restricted to specifically fulfill certain obligations of Nexsan.
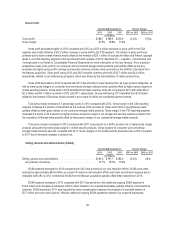
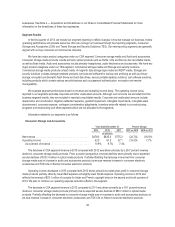
Analysis of Cash Flows
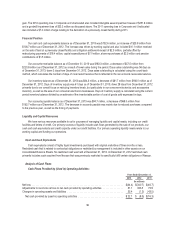
Cash Flows Provided by (Used In) Operating Activities:
Years Ended December 31,
2013 2012 2011
(In millions)
Net loss ................................................................... $(44.4) $(340.7) $(46.7)
Adjustments to reconcile net loss to net cash provided by operating activities ............... 31.1 333.5 73.9
Changes in operating assets and liabilities ......................................... 35.4 (1.3) (43.5)
Net cash provided by (used in) operating activities ................................. $22.1 $ (8.5) $(16.3)
36