Memorex 2013 Annual Report Download - page 36
Download and view the complete annual report
Please find page 36 of the 2013 Memorex annual report below. You can navigate through the pages in the report by either clicking on the pages listed below, or by using the keyword search tool below to find specific information within the annual report.-
 1
1 -
2
-
3
-
4
-
5
-
6
-
7
-
8
-
9
-
10
-
11
-
12
-
13
-
14
-
15
-
16
-
17
-
18
-
19
-
20
-
21
-
22
-
23
-
24
-
25
-
 26
26 -
 27
27 -
 28
28 -
 29
29 -
 30
30 -
 31
31 -
 32
32 -
 33
33 -
 34
34 -
 35
35 -
 36
36 -
 37
37 -
 38
38 -
 39
39 -
 40
40 -
 41
41 -
 42
42 -
 43
43 -
 44
44 -
 45
45 -
 46
46 -
47
-
48
-
49
-
50
-
51
-
52
-
53
-
54
-
55
-
56
-
57
-
58
-
59
-
60
-
61
-
62
-
63
-
64
-
65
-
66
-
67
-
68
-
69
-
70
-
71
-
72
-
73
-
74
-
75
-
76
-
77
-
78
-
79
-
80
-
81
-
82
-
83
-
84
-
85
-
86
-
87
-
88
-
89
-
90
-
91
-
92
-
93
-
94
-
95
-
96
-
97
-
98
-
99
-
100
-
101
-
102
-
103
-
104
-
105
-
106
-
107
-
108
-
109
-
110
-
111
-
112
-
113
-
114
-
115
-
116
-
117
-
118
-
119
-
120
-
121
-
122
 |
 |

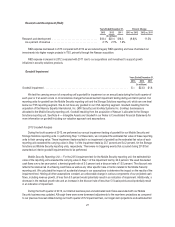
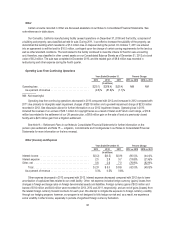
Other expense decreased in 2012 compared with 2011. Interest expense decreased compared with 2011 due to lower
amortization of capitalized fees related to securing our credit facility and decreased imputed interest related to our liability for
a prior litigation settlement. Other, net expense decreased in 2012 compared with 2011 due to decreases in foreign currency
losses of $3.0 million. Other, net in 2012 also includes an investment recovery of $0.9 million.
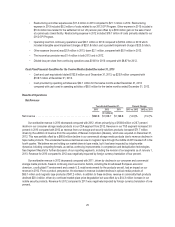
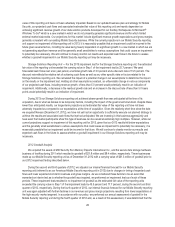
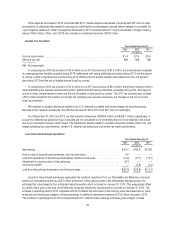
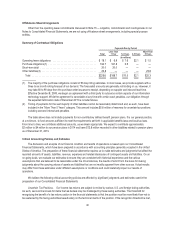
Income Tax Provision
Years Ended December 31,
2013 2012 2011
(In millions)
Income tax provision ...................................................... $1.4 $1.4 $5.0
Effective tax rate ......................................................... NM NM NM
NM - Not meaningful
In comparing our 2013 tax provision of $1.4 million to our 2012 tax provision of $1.4 million, the amounts were impacted
by unrecognized tax benefits recorded during 2013, settlements with taxing authorities concluded during 2012 and the impact
of activity in other comprehensive income during 2012 offset by the tax benefit related to the settlement of our UK pension
plan during 2013 and the mix of taxable income (loss) by country.
In comparing our 2012 tax provision of $1.4 million to our 2011 tax provision of $5.0 million, the primary change is due to
lower withholding tax expense incurred during 2012, settlements with taxing authorities concluded during 2012, the impact of
activity in other comprehensive income and the mix of taxable income (loss) by country. The 2011 tax provision also included
a $5.0 million benefit for the reversal of a foreign net operating loss valuation allowance and changes in the mix of income
(loss) by jurisdiction.
We maintain a valuation allowance related to our U.S. deferred tax assets and certain foreign net operating losses.
Because of the valuation allowances, the effective tax rates for 2013, 2012 and 2011 are not meaningful.
As of December 31, 2013 and 2012, we had valuation allowances of $239.4 million and $239.1 million, respectively, to
account for deferred tax assets we have concluded are not considered to be more-likely-than-not to be realized in the future
due to our cumulative losses in recent years. The deferred tax assets subject to valuation allowance include certain U.S. and
foreign operating loss carryforwards, certain U.S. deferred tax deductions and certain tax credit carryforwards.
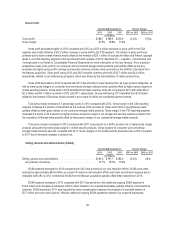
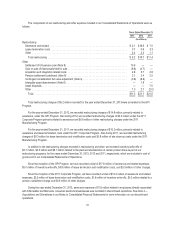
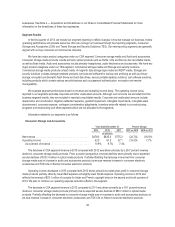
Loss from discontinued operations
Years Ended December 31,
2013 2012 2011
(In millions)
Net revenue ............................................................ $40.7 $ 92.9 $123.8
Gain on sale of discontinued businesses, net of income taxes ....................... 0.9 — —
Loss from operations of discontinued businesses, before income taxes ................ (14.2) (17.7) (12.7)
Adjustment to carrying value of disposal group .................................. (6.7) — —
Income tax benefit ....................................................... — (1.8) (1.2)
Loss from discontinued businesses, net of income taxes ........................... $(20.0) $(15.9) $ (11.5)
Loss from discontinued businesses represents the results of operations from our XtremeMac and Memorex consumer
electronics businesses as well as a $6.7 million write-down of the carrying value of the XtremeMac disposal group to its
estimated fair value based on the anticipated sales transaction which occurred on January 31, 2014. This was partially offset
by a $0.9 million gain on the sale of the Memorex consumer electronics business which occurred on October 15, 2013. The
increase in operating loss for 2013 compared with 2012 reflects the write-down of the carrying value discussed above, lower
revenues and lower gross margins in these businesses in addition to severance expense of $1.6 million recorded in 2013.
The increase in operating loss for 2012 compared with 2011 reflects lower revenues and lower gross margins in these
33