Memorex 2013 Annual Report Download - page 67
Download and view the complete annual report
Please find page 67 of the 2013 Memorex annual report below. You can navigate through the pages in the report by either clicking on the pages listed below, or by using the keyword search tool below to find specific information within the annual report.-
 1
1 -
2
-
3
-
4
-
5
-
6
-
7
-
8
-
9
-
10
-
11
-
12
-
13
-
14
-
15
-
16
-
17
-
18
-
19
-
20
-
21
-
22
-
23
-
24
-
25
-
26
-
27
-
28
-
29
-
30
-
31
-
32
-
33
-
34
-
35
-
36
-
37
-
38
-
39
-
40
-
41
-
42
-
43
-
44
-
45
-
46
-
47
-
48
-
49
-
50
-
51
-
52
-
53
-
54
-
55
-
56
-
 57
57 -
 58
58 -
 59
59 -
 60
60 -
 61
61 -
 62
62 -
 63
63 -
 64
64 -
 65
65 -
 66
66 -
 67
67 -
 68
68 -
 69
69 -
 70
70 -
 71
71 -
 72
72 -
 73
73 -
 74
74 -
 75
75 -
 76
76 -
 77
77 -
78
-
79
-
80
-
81
-
82
-
83
-
84
-
85
-
86
-
87
-
88
-
89
-
90
-
91
-
92
-
93
-
94
-
95
-
96
-
97
-
98
-
99
-
100
-
101
-
102
-
103
-
104
-
105
-
106
-
107
-
108
-
109
-
110
-
111
-
112
-
113
-
114
-
115
-
116
-
117
-
118
-
119
-
120
-
121
-
122
 |
 |

NOTES TO CONSOLIDATED FINANCIAL STATEMENTS — (Continued)
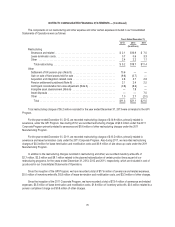
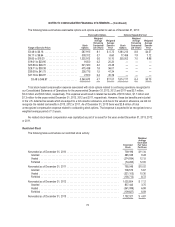
We had $5.2 million and $2.5 million of assets classified as held for sale as of December 31, 2013 and 2012,
respectively.
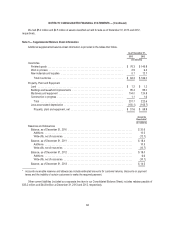
Note 5 — Supplemental Balance Sheet Information
Additional supplemental balance sheet information is provided in the tables that follow.
As of December 31,
2013 2012
(In millions)
Inventories
Finished goods ....................................................... $ 76.3 $ 146.9
Work in process ...................................................... 2.9 6.4
Raw materials and supplies ............................................. 5.1 12.7
Total inventories .................................................... $ 84.3 $ 166.0
Property, Plant and Equipment
Land .............................................................. $ 1.2 $ 1.2
Buildings and leasehold improvements ..................................... 95.4 95.0
Machinery and equipment ............................................... 104.0 124.8
Construction in progress ................................................ 1.1 1.6
Total ............................................................ 201.7 222.6
Less accumulated depreciation ........................................... (150.1) (163.7)
Property, plant and equipment, net ...................................... $ 51.6 $ 58.9
Accounts
Receivable*
(In millions)
Reserves and Allowances
Balance, as of December 31, 2010 ............................................... $20.6
Additions ................................................................ 10.5
Write-offs, net of recoveries .................................................. (12.7)
Balance, as of December 31, 2011 ............................................... $18.4
Additions ................................................................ 10.3
Write-offs, net of recoveries .................................................. (10.7)
Balance, as of December 31, 2012 ............................................... $18.0
Additions ................................................................ 6.6
Write-offs, net of recoveries .................................................. (10.1)
Balance, as of December 31, 2013 ............................................... $14.5
* Accounts receivable reserves and allowances include estimated amounts for customer returns, discounts on payment
terms and the inability of certain customers to make the required payment.
Other current liabilities (included as a separate line item in our Consolidated Balance Sheet) includes rebates payable of
$33.2 million and $44.8 million at December 31, 2013 and 2012, respectively.
64