Memorex 2013 Annual Report Download - page 62
Download and view the complete annual report
Please find page 62 of the 2013 Memorex annual report below. You can navigate through the pages in the report by either clicking on the pages listed below, or by using the keyword search tool below to find specific information within the annual report.-
 1
1 -
2
-
3
-
4
-
5
-
6
-
7
-
8
-
9
-
10
-
11
-
12
-
13
-
14
-
15
-
16
-
17
-
18
-
19
-
20
-
21
-
22
-
23
-
24
-
25
-
26
-
27
-
28
-
29
-
30
-
31
-
32
-
33
-
34
-
35
-
36
-
37
-
38
-
39
-
40
-
41
-
42
-
43
-
44
-
45
-
46
-
47
-
48
-
49
-
50
-
51
-
 52
52 -
 53
53 -
 54
54 -
 55
55 -
 56
56 -
 57
57 -
 58
58 -
 59
59 -
 60
60 -
 61
61 -
 62
62 -
 63
63 -
 64
64 -
 65
65 -
 66
66 -
 67
67 -
 68
68 -
 69
69 -
 70
70 -
 71
71 -
 72
72 -
73
-
74
-
75
-
76
-
77
-
78
-
79
-
80
-
81
-
82
-
83
-
84
-
85
-
86
-
87
-
88
-
89
-
90
-
91
-
92
-
93
-
94
-
95
-
96
-
97
-
98
-
99
-
100
-
101
-
102
-
103
-
104
-
105
-
106
-
107
-
108
-
109
-
110
-
111
-
112
-
113
-
114
-
115
-
116
-
117
-
118
-
119
-
120
-
121
-
122
 |
 |

NOTES TO CONSOLIDATED FINANCIAL STATEMENTS — (Continued)
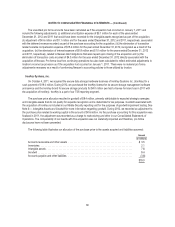
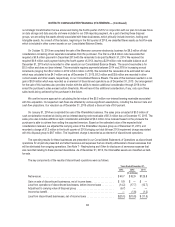
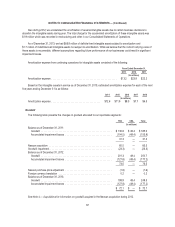
adjustments upon finalization of these balances. The following table illustrates our allocation of the purchase price to the
assets acquired and liabilities assumed as of December 31, 2013:
Amount
(In millions)
Cash ....................................................................... $ 0.8
Accounts receivable ............................................................ 14.6
Inventory .................................................................... 6.9
Prepaid and other .............................................................. 9.0
Property, plant and equipment .................................................... 5.2
Intangible assets ............................................................... 42.6
Goodwill ..................................................................... 63.9
Other assets .................................................................. 0.6
Accounts payable .............................................................. (5.3)
Accrued expenses ............................................................. (10.0)
Deferred revenue — current ...................................................... (4.3)
Deferred revenue — non-current ................................................... (2.5)
Other long-term liabilities ........................................................ (3.0)
$118.5
Of the $120.1 million of consideration paid in 2012, approximately $11.9 million was paid directly to creditors of Nexsan
in full satisfaction of Nexsan obligations that were required to be repaid at the time of closing based on the merger agreement.
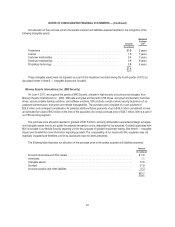
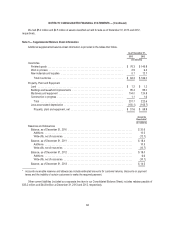
Our allocation of the purchase price to the assets acquired and liabilities assumed resulted in the recognition of the
following intangible assets:
Amount
Weighted
Average
Life
(In millions)
Trade names ....................................................... $ 3.1 5years
Other — developed technology .......................................... 19.4 3-7 years
Other — research and development technology ............................. 1.7 NA
Customer relationships ................................................ 18.4 12 years
$42.6
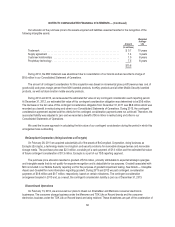
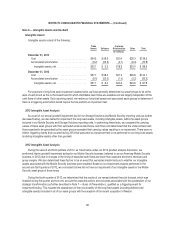
Nexsan did not contribute to the revenue or earnings of Imation for the year ended December 31, 2012, as it was
acquired on December 31, 2012. The following unaudited supplemental pro forma information is provided for illustrative
purposes only, giving effect to the combination as if the acquisition of Nexsan had occurred on January 1, 2011 and should
not be relied upon as being indicative of the historical results that would have been obtained if the acquisition had actually
occurred on that date, nor of the results that may be obtained in the future.
Pro Forma Year End
December 31
(Unaudited)
2012 2011
(In millions)
Net revenue ......................................................... $1,088.7 $1,247.2
Loss from continuing operations .......................................... $ (328.5) $ (44.7)
59