Memorex 2013 Annual Report Download - page 28
Download and view the complete annual report
Please find page 28 of the 2013 Memorex annual report below. You can navigate through the pages in the report by either clicking on the pages listed below, or by using the keyword search tool below to find specific information within the annual report.-
 1
1 -
2
-
3
-
4
-
5
-
6
-
7
-
8
-
9
-
10
-
11
-
12
-
13
-
14
-
15
-
16
-
17
-
 18
18 -
 19
19 -
 20
20 -
 21
21 -
 22
22 -
 23
23 -
 24
24 -
 25
25 -
 26
26 -
 27
27 -
 28
28 -
 29
29 -
 30
30 -
 31
31 -
 32
32 -
 33
33 -
 34
34 -
 35
35 -
 36
36 -
 37
37 -
 38
38 -
39
-
40
-
41
-
42
-
43
-
44
-
45
-
46
-
47
-
48
-
49
-
50
-
51
-
52
-
53
-
54
-
55
-
56
-
57
-
58
-
59
-
60
-
61
-
62
-
63
-
64
-
65
-
66
-
67
-
68
-
69
-
70
-
71
-
72
-
73
-
74
-
75
-
76
-
77
-
78
-
79
-
80
-
81
-
82
-
83
-
84
-
85
-
86
-
87
-
88
-
89
-
90
-
91
-
92
-
93
-
94
-
95
-
96
-
97
-
98
-
99
-
100
-
101
-
102
-
103
-
104
-
105
-
106
-
107
-
108
-
109
-
110
-
111
-
112
-
113
-
114
-
115
-
116
-
117
-
118
-
119
-
120
-
121
-
122
 |
 |

• Restructuring and other expense was $11.3 million in 2013 compared to $21.1 million in 2012. Restructuring
expense in 2013 included $5.2 million of costs related to our 2012 GPI Program. Other expense in 2013 included a
$10.6 million loss related to the settlement of our UK pension plan offset by a $9.8 million gain on the sale of land
at a previously closed facility. Restructuring expense in 2012 included $19.7 million of costs primarily related to our
2012 GPI Program.
• Operating loss from continuing operations was $20.1 million in 2013 compared to $318.4 million in 2012 which
included intangible asset impairment charges of $251.8 million and a goodwill impairment charge of $23.3 million.
• Other expense (income) was $2.9 million in 2013, down $2.1 million, compared with $5.0 million in 2012.
• The income tax provision was $1.4 million in both 2013 and in 2012.
• Diluted loss per share from continuing operations was $0.60 for 2013 compared with $8.67 for 2012.
Cash Flow/Financial Condition for the Twelve Months Ended December 31, 2013
• Cash and cash equivalents totaled $132.6 million as of December 31, 2013, up $23.9 million compared with
$108.7 million at December 31, 2012.
• Cash provided by operating activities was $22.1 million for the twelve months ended December 31, 2013
compared with cash used in operating activities of $8.5 million for the twelve months ended December 31, 2012.
Results of Operations
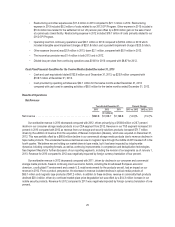
Net Revenue
Years Ended December 31, Percent Change
2013 2012 2011 2013 vs. 2012 2012 vs. 2011
(In millions)
Net revenue ....................................... $860.8 $1,006.7 $1,166.6 (14.5)% (13.7)%
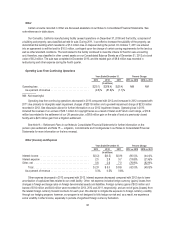
Our worldwide revenue in 2013 decreased compared with 2012, driven primarily by a $158.6 million or 26.7 percent
decline in our consumer storage media products in our CSA segment from 2012. Revenue in our TSS segment increased 3.0
percent in 2013 compared with 2012 as revenue from our storage and security solutions products increased $71.7 million
driven by the addition of revenue from the acquisition of Nexsan Corporation (Nexsan), which was acquired on December 31,
2012. This was partially offset by a $60.6 million decline in our commercial storage media products due to revenue declines in
tape media products. The accelerated revenue declines we saw in magnetic tape through the middle of 2013 leveled off in the
fourth quarter. We believe we are holding our market share in tape media, but it has been impacted by industry wide
dynamics including competing formats, as well as continuing improvements in compression and deduplication technologies.
See Segment Results for further discussion of our reporting segments, including the revision of our segments as of January 1,
2013. Revenue for 2013 compared to 2012 was negatively impacted by foreign currency translation of four percent.
Our worldwide revenue in 2012 decreased compared with 2011, driven by declines in our consumer and commercial
storage media products. Several continuing macro-economic factors, including the broad-based European economic
downturn, a soft global IT environment and a weak U.S. retail environment for the products we sell, had an impact on our
revenue in 2012. From a product perspective, the decrease in revenue included declines in optical media products of
$85.1 million and magnetic tape products of $41.2 million. In addition to these declines, revenue in commodity flash products
declined $20.4 million, driven by continued market place price degradation but was offset by a $14.3 million increase in our
mobile security products. Revenue for 2012 compared to 2011 was negatively impacted by foreign currency translation of one
percent.
25