Memorex 2013 Annual Report Download - page 69
Download and view the complete annual report
Please find page 69 of the 2013 Memorex annual report below. You can navigate through the pages in the report by either clicking on the pages listed below, or by using the keyword search tool below to find specific information within the annual report.-
 1
1 -
2
-
3
-
4
-
5
-
6
-
7
-
8
-
9
-
10
-
11
-
12
-
13
-
14
-
15
-
16
-
17
-
18
-
19
-
20
-
21
-
22
-
23
-
24
-
25
-
26
-
27
-
28
-
29
-
30
-
31
-
32
-
33
-
34
-
35
-
36
-
37
-
38
-
39
-
40
-
41
-
42
-
43
-
44
-
45
-
46
-
47
-
48
-
49
-
50
-
51
-
52
-
53
-
54
-
55
-
56
-
57
-
58
-
 59
59 -
 60
60 -
 61
61 -
 62
62 -
 63
63 -
 64
64 -
 65
65 -
 66
66 -
 67
67 -
 68
68 -
 69
69 -
 70
70 -
 71
71 -
 72
72 -
 73
73 -
 74
74 -
 75
75 -
 76
76 -
 77
77 -
 78
78 -
 79
79 -
80
-
81
-
82
-
83
-
84
-
85
-
86
-
87
-
88
-
89
-
90
-
91
-
92
-
93
-
94
-
95
-
96
-
97
-
98
-
99
-
100
-
101
-
102
-
103
-
104
-
105
-
106
-
107
-
108
-
109
-
110
-
111
-
112
-
113
-
114
-
115
-
116
-
117
-
118
-
119
-
120
-
121
-
122
 |
 |

NOTES TO CONSOLIDATED FINANCIAL STATEMENTS — (Continued)
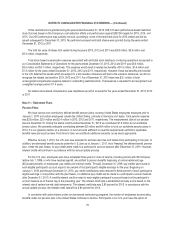
Based on the facts that existed in the fourth quarter and as of December 31, 2012, all of our long-lived assets were
evaluated for impairment under the “held and used” impairment model and, while we were in the process of exploring
strategic options (including potential disposition) of our XtremeMac and Memorex brands (pertaining only to the consumer
electronics products), such asset groups did not qualify as being classified as held-for-sale as of December 31, 2012 as the
criteria for such classification were not met as of that date.
We compared the carrying value of our asset groups with their estimated undiscounted future cash flows and
determined that the carrying value of certain asset groups exceeded the undiscounted cash flows expected to be generated
by the asset group. For those asset groups, we then compared the carrying value of the asset group to its estimated fair value
to determine the amount by which our long-lived assets (primarily intangible assets) within the asset group were impaired. As
a result of these analyses, we recorded an impairment charge of $260.5 million in our Consolidated Statements of Operations
for the year ended December 31, 2012. During 2013, the impairment charge of $8.7 million that related to our Memcorp Asset
Group was reclassified to discontinued operations and thus the 2012 impairment charge from continuing operations in our
Consolidated Statement of Operations as of December 31, 2013 is reported as $251.8 million. See Note 4 — Acquisitions and
Divestitures for more information on our discontinued operations.
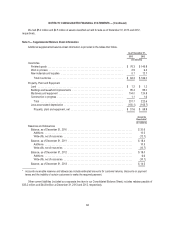
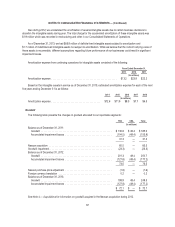
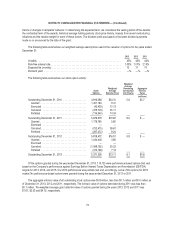
The impairment of these intangible assets was accounted for in accordance with ASC 360-10. The following illustrates
the carrying values, estimated fair values and impairment losses recorded, by asset group, associated with the fourth quarter
2012 impairment charge:
Carrying
Value
Estimated
Fair Value Impairment
(In millions)
Memorex Asset Group ..................................... $164.1 $8.6 $155.5
TDK Asset Group ......................................... 96.7 6.3 90.4
Memcorp Asset Group ..................................... 8.7 — 8.7
Imation Asset Group ....................................... 5.9 — 5.9
Total ................................................... $260.5
The intangible assets included within each of the above asset groups (all of which were impaired) consisted primarily of
trade names, customer lists and intellectual property relating to each brand. The remaining intangible assets within the
Memorex and TDK asset groups as of December 31, 2012 subsequent to the impairment charge consisted of trade names.
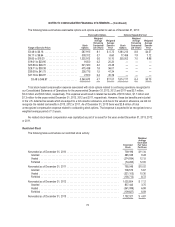
In reviewing these asset groups to determine whether a triggering event had occurred which would require an
impairment test, we assessed factors impacting the asset groups including our views associated with changes in the
estimated future cash flows associated with each of our asset groups. Revenues for the Memorex, TDK and Imation asset
groups are derived primarily from sales of optical and magnetic media with each asset group having its own separately
identifiable stream of cash flows. Revenues for the Memcorp asset group are derived primarily from sales of consumer
electronics under the Memorex brand name. During the fourth quarter of 2012, the magnitude of decline in certain of our key
product lines across the aforementioned asset groups widened and, at that time, we determined that we now expected this
rate of decline to continue into the foreseeable future. This determination resulted in our decision in the fourth quarter of 2012
to accelerate our strategic transformation (as further described in Note 1 — Basis of Presentation) and to further focus our
efforts on our growth categories in data storage and data security. As a result of this determination in the fourth quarter of
2012, we revised our revenue forecast and projected cash flows and accordingly, concluded that a triggering event to test our
long-lived assets for impairment had occurred.
As a part of this analysis, we also re-assessed the useful lives of any remaining intangible assets, excluding the
intangible assets acquired in the recent Nexsan acquisition, and adjusted the remaining lives as necessary.
66