Memorex 2013 Annual Report Download - page 76
Download and view the complete annual report
Please find page 76 of the 2013 Memorex annual report below. You can navigate through the pages in the report by either clicking on the pages listed below, or by using the keyword search tool below to find specific information within the annual report.-
 1
1 -
2
-
3
-
4
-
5
-
6
-
7
-
8
-
9
-
10
-
11
-
12
-
13
-
14
-
15
-
16
-
17
-
18
-
19
-
20
-
21
-
22
-
23
-
24
-
25
-
26
-
27
-
28
-
29
-
30
-
31
-
32
-
33
-
34
-
35
-
36
-
37
-
38
-
39
-
40
-
41
-
42
-
43
-
44
-
45
-
46
-
47
-
48
-
49
-
50
-
51
-
52
-
53
-
54
-
55
-
56
-
57
-
58
-
59
-
60
-
61
-
62
-
63
-
64
-
65
-
 66
66 -
 67
67 -
 68
68 -
 69
69 -
 70
70 -
 71
71 -
 72
72 -
 73
73 -
 74
74 -
 75
75 -
 76
76 -
 77
77 -
 78
78 -
 79
79 -
 80
80 -
 81
81 -
 82
82 -
 83
83 -
 84
84 -
 85
85 -
 86
86 -
87
-
88
-
89
-
90
-
91
-
92
-
93
-
94
-
95
-
96
-
97
-
98
-
99
-
100
-
101
-
102
-
103
-
104
-
105
-
106
-
107
-
108
-
109
-
110
-
111
-
112
-
113
-
114
-
115
-
116
-
117
-
118
-
119
-
120
-
121
-
122
 |
 |

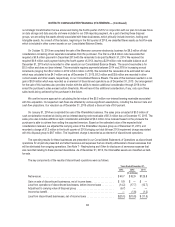
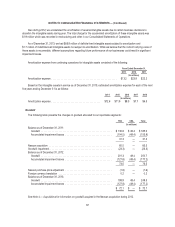
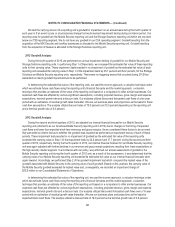
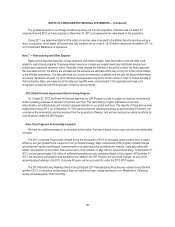
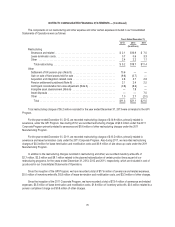
NOTES TO CONSOLIDATED FINANCIAL STATEMENTS — (Continued)
trends or changes in recipients’ behavior. In determining the expected term, we considered the vesting period of the awards,
the contractual term of the awards, historical average holding periods, stock price history, impacts from recent restructuring
initiatives and the relative weight for each of these factors. The dividend yield was based on the latest dividend payments
made on or announced by the date of the grant.
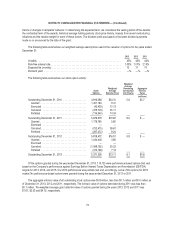
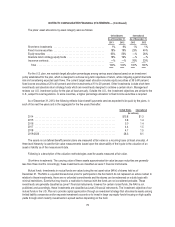
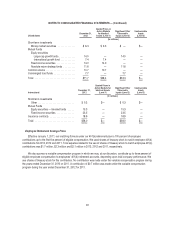
The following table summarizes our weighted average assumptions used in the valuation of options for the years ended
December 31:
2013 2012 2011
Volatility ............................................................ 43% 45% 44%
Risk-free interest rate ................................................... 1.05% 1.07% 2.13%
Expected life (months) .................................................. 72 71 70
Dividend yield ........................................................ —% —% —%
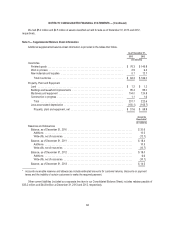
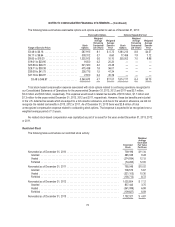
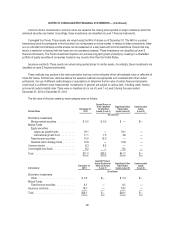
The following table summarizes our stock option activity:
Stock
Options
Weighted
Average
Exercise Price
Weighted
Average
Remaining
Contractual
Life (Years)
Aggregate
Intrinsic
Value
(millions)
Outstanding December 31, 2010 ................. 4,916,088 $24.10 5.6 $0.7
Granted .................................. 1,401,163 9.41
Exercised ................................ (45,429) 10.13
Canceled ................................. (475,703) 35.11
Forfeited ................................. (116,540) 14.34
Outstanding December 31, 2011 ................. 5,679,579 $19.87 6.0 $ —
Granted .................................. 1,178,780 5.80
Exercised ................................ — —
Canceled ................................. (752,415) 26.61
Forfeited ................................. (287,472) 9.24
Outstanding December 31, 2012 ................. 5,818,472 $16.57 5.9 $ —
Granted .................................. 1,034,406 3.85
Exercised ................................ — —
Canceled ................................. (1,069,192) 25.22
Forfeited ................................. (412,148) 7.13
Outstanding December 31, 2013 ................. 5,371,538 $13.11 6.1 $0.8
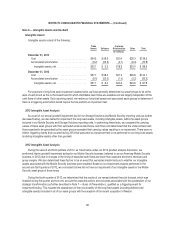
Of the options granted during the year ended December 31, 2013, 113,125 were performance-based options that vest
based on the Company’s performance against Earnings Before Interest Taxes Depreciation and Amortization (EBITDA)
targets for 2013, 2014, and 2015. Our 2013 performance was partially met and, accordingly, some of the options for 2013
vested. No performance-based options were granted during the years ended December 31, 2012 or 2011.
The aggregate intrinsic value of all outstanding stock options was $0.8 million, less than $0.1 million and $0.0 million as
of December 31, 2013, 2012 and 2011, respectively. The intrinsic value of options exercised during 2011 was less than
$0.1 million. The weighted average grant date fair value of options granted during the years 2013, 2012 and 2011 was
$1.61, $2.53 and $4.15, respectively.
73