Kodak 2004 Annual Report Download - page 18
Download and view the complete annual report
Please find page 18 of the 2004 Kodak annual report below. You can navigate through the pages in the report by either clicking on the pages listed below, or by using the keyword search tool below to find specific information within the annual report.-
 1
1 -
2
-
3
-
4
-
5
-
6
-
7
-
 8
8 -
 9
9 -
 10
10 -
 11
11 -
 12
12 -
 13
13 -
 14
14 -
 15
15 -
 16
16 -
 17
17 -
 18
18 -
 19
19 -
 20
20 -
 21
21 -
 22
22 -
 23
23 -
 24
24 -
 25
25 -
 26
26 -
 27
27 -
 28
28 -
29
-
30
-
31
-
32
-
33
-
34
-
35
-
36
-
37
-
38
-
39
-
40
-
41
-
42
-
43
-
44
-
45
-
46
-
47
-
48
-
49
-
50
-
51
-
52
-
53
-
54
-
55
-
56
-
57
-
58
-
59
-
60
-
61
-
62
-
63
-
64
-
65
-
66
-
67
-
68
-
69
-
70
-
71
-
72
-
73
-
74
-
75
-
76
-
77
-
78
-
79
-
80
-
81
-
82
-
83
-
84
-
85
-
86
-
87
-
88
-
89
-
90
-
91
-
92
-
93
-
94
-
95
-
96
-
97
-
98
-
99
-
100
-
101
-
102
-
103
-
104
-
105
-
106
-
107
-
108
-
109
-
110
-
111
-
112
-
113
-
114
-
115
-
116
-
117
-
118
-
119
-
120
-
121
-
122
-
123
-
124
-
125
-
126
-
127
-
128
-
129
-
130
-
131
-
132
-
133
-
134
-
135
-
136
-
137
-
138
-
139
-
140
-
141
-
142
-
143
-
144
-
145
-
146
-
147
-
148
-
149
-
150
-
151
-
152
-
153
-
154
-
155
-
156
-
157
-
158
-
159
-
160
-
161
-
162
-
163
-
164
-
165
-
166
-
167
-
168
-
169
-
170
-
171
-
172
-
173
-
174
-
175
-
176
-
177
-
178
-
179
-
180
-
181
-
182
-
183
-
184
-
185
-
186
-
187
-
188
-
189
-
190
-
191
-
192
 |
 |

Financials
16
E A S T M A N K OD A K C O M PA N Y
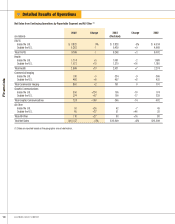
sentinganincreaseof$255million,or10%asreported,oranincreaseof
7%excludingthefavorableimpactofexchange.Theincreaseinsaleswas
comprisedof:(1)anincreasefromfavorableexchangeofapproximately
3.5percentagepoints,(2)theacquisitionofPracticeWorks,Inc.inOctober
2003,whichaccountedforapproximately5.4percentagepointsofthe
salesincreaseand(3)anincreaseinvolumeofapproximately4.1percent-
agepoints,drivenprimarilybyvolumeincreasesindigitalproducts.These
increaseswerepartiallyoffsetbydeclinesinprice/mixofapproximately
3.1percentagepoints,whichwererelatedtobothdigitalandtraditional
products.
NetsalesintheU.S.were$1,114millionforthecurrentyearas
comparedwith$1,061fortheprioryear,representinganincreaseof$53
million,or5%.NetsalesoutsidetheU.S.were$1,572millionfor2004as
comparedwith$1,370millionfor2003,representinganincreaseof$202
million,or15%asreported,oranincreaseof8%excludingthefavorable
impactofexchange.
DigitalStrategicProductGroups’RevenuesHealthsegmentdigital
sales,whichincludelaserprinters(DryViewimagersandwetlaserprint-
ers),digitalmedia(DryViewandwetlasermedia),digitalcaptureequip-
ment(computedradiographycaptureequipmentanddigitalradiography
equipment),services,dentalpracticemanagementsoftwareandPicture
ArchivingandCommunicationsSystems(PACS),were$1,719forthecur-
rentyearcomparedwith$1,438millionfor2003,representinganincrease
of$281million,or20%.Theincreaseindigitalproductsaleswasprimarily
attributabletothePracticeWorksacquisitionandhighervolumesofdigital
captureequipment,digitalmediaandservices.
TraditionalStrategicProductGroups’RevenuesHealthsegment
traditionalproductsales,includinganalogfilm,equipment,chemistryand
services,were$967millionforthecurrentyearascomparedwith$993
millionfor2003,representingadecreaseof$26millionor3%,withthe
decreasemainlyattributabletodecreasesinvolumeandnegativeprice/mix
fromanalogmedicalfilm,partiallyoffsetbyfavorableexchange.
GrossProfitGrossprofitfortheHealthsegmentwas$1,129millionfor
2004ascomparedwith$1,045millionfor2003,representinganincrease
of$84million,or8%.Thegrossprofitmarginwas42.0%in2004as
comparedwith43.0%in2003.Thedecreaseinthegrossprofitmargin
of1.0percentagepointswasprimarilyattributableto:(1)price/mixwhich
negativelyimpactedgrossprofitmarginsby2.0percentagepointsdueto
digitalmedia,digitalcaptureequipmentandanalogmedicalfilmand(2)
anincreaseinmanufacturingcost,whichdecreasedgrossprofitmargins
by0.9percentagepointsprimarilyduetoincreasesinsilverpricesand
petroleum-basedmaterialsduringthecurrentyear.Thesedecreaseswere
partiallyoffsetbyincreasesattributabletofavorableexchange,which
contributedapproximately0.8percentagepointstothegrossprofitmargin,
andtheacquisitionofPracticeWorksinthefourthquarterof2003,which
increasedgrossprofitmarginsbyapproximately1.1percentagepointsfor
thecurrentyear.
Selling,GeneralandAdministrativeExpensesSG&Aexpensesfor
theHealthsegmentincreased$95million,or24%,from$391million
for2003to$486millionfor2004.AlthoughthedollarincreaseinSG&A
expenseswassignificant,theincreaseasapercentofsaleswasonly2.0
percentagepointsfrom16%in2003to18%in2004.Theincreasein
SG&AexpensesisprimarilyduetotheacquisitionofPracticeWorks,which
accountedfor$65millionoftheincreaseinSG&Aexpensesin2004,
increasedspendingongrowthinitiativesandtheunfavorableimpactof
exchange,whichaccountedfor$12millionoftheincrease.
ResearchandDevelopmentCostsR&DcostsfortheHealthsegment
increased$30million,or17%,from$178millionin2003to$208million
in2004,andincreasedasapercentageofsalesfrom7%in2003to8%in
2004.Theincreaseisprimarilyattributabletoincreasedspendingtodrive
growthinselectedareasoftheproductportfolio.
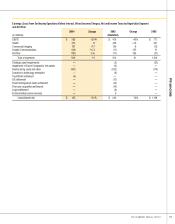
Earnings(Losses)FromContinuingOperationsBeforeInterest,
OtherIncome(Charges),NetandIncomeTaxesEarningsfrom
continuingoperationsbeforeinterest,otherincome(charges),netand
incometaxesfortheHealthsegmentdecreased$41million,or9%,from
$476millionfor2003to$435millionfor2004dueprimarilytothereasons
describedabove.
CommercialImaging
OnFebruary9,2004KodakannounceditsintentiontoselltheRemote
SensingSystems(RSS)operationtoITTIndustriesfor$725millionincash.
Thistransactionclosedduringthethirdquarterof2004.TheRSSbusiness
waspartofKodak’scommercialandgovernmentsystemsoperation.The
CommercialImagingsegmentresultsfor2004and2003excludethe
financialperformanceofKodak’sRSSbusiness,whichisaccountedforin
discontinuedoperations.Certainoverheadcoststhatwerepreviouslyal-
locatedtotheRSSbusinessthatwerenoteliminatedasaresultofthesale
arestillbeingreportedwithintheCommercialImagingsegmentupthrough
thecompletionofthedivestiture,astheCommercialImagingsegment
managedtheRSSbusinessuntilthecompletionofthedivestiture.Subse-
quentoverheadcostshavebeenallocatedtoalloftheexistingsegments.
WorldwideRevenuesNetworldwidesalesfortheCommercialImag-
ingsegmentwere$803millionfor2004ascomparedwith$791million
for2003,representinganincreaseof$12million,or2%asreported,ora
decreaseof3%excludingthefavorableimpactofexchange.Theincrease
innetsaleswasprimarilycomprisedofanincreaseofapproximately4.7
percentagepointsduetofavorableexchange,whichwaspartiallyoffsetby
declinesduetovolumeofapproximately3.1percentagepoints,primarily
drivenbydeclinesinthemicrographicsequipmentandmediaSPG.
NetsalesintheU.S.were$318millionfor2004ascomparedwith
$334millionfor2003,representingadecreaseof$16million,or5%.Net
salesoutsidetheU.S.were$485millioninthecurrentyearascompared
with$457millionintheprioryear,representinganincreaseof$28million,
or6%,oradecreaseof2%excludingthefavorableimpactofexchange.
DigitalandTraditionalStrategicProductGroups’RevenuesCom-
mercialImagingsegmentdigitalproductsaleswere$384millionforthe
currentyearascomparedwith$367millionfor2003,representingan
increaseof$17million,or5%.Segmenttraditionalproductsaleswere
$419millionforthecurrentyearascomparedwith$424millionfor2003,
representingadecreaseof$5million,or1%.Theprimarydriverwasan