Food Lion 2010 Annual Report Download - page 82
Download and view the complete annual report
Please find page 82 of the 2010 Food Lion annual report below. You can navigate through the pages in the report by either clicking on the pages listed below, or by using the keyword search tool below to find specific information within the annual report.-
 1
1 -
2
-
3
-
4
-
5
-
6
-
7
-
8
-
9
-
10
-
11
-
12
-
13
-
14
-
15
-
16
-
17
-
18
-
19
-
20
-
21
-
22
-
23
-
24
-
25
-
26
-
27
-
28
-
29
-
30
-
31
-
32
-
33
-
34
-
35
-
36
-
37
-
38
-
39
-
40
-
41
-
42
-
43
-
44
-
45
-
46
-
47
-
48
-
49
-
50
-
51
-
52
-
53
-
54
-
55
-
56
-
57
-
58
-
59
-
60
-
61
-
62
-
63
-
64
-
65
-
66
-
67
-
68
-
69
-
70
-
71
-
 72
72 -
 73
73 -
 74
74 -
 75
75 -
 76
76 -
 77
77 -
 78
78 -
 79
79 -
 80
80 -
 81
81 -
 82
82 -
 83
83 -
 84
84 -
 85
85 -
 86
86 -
 87
87 -
 88
88 -
 89
89 -
 90
90 -
 91
91 -
 92
92 -
93
-
94
-
95
-
96
-
97
-
98
-
99
-
100
-
101
-
102
-
103
-
104
-
105
-
106
-
107
-
108
-
109
-
110
-
111
-
112
-
113
-
114
-
115
-
116
-
117
-
118
-
119
-
120
-
121
-
122
-
123
-
124
-
125
-
126
-
127
-
128
-
129
-
130
-
131
-
132
-
133
-
134
-
135
-
136
-
137
-
138
-
139
-
140
-
141
-
142
-
143
-
144
-
145
-
146
-
147
-
148
-
149
-
150
-
151
-
152
-
153
-
154
-
155
-
156
-
157
-
158
-
159
-
160
-
161
-
162
 |
 |

78
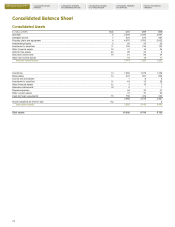
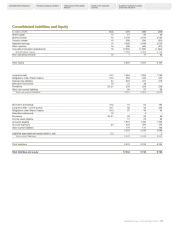
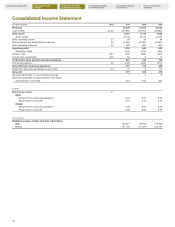
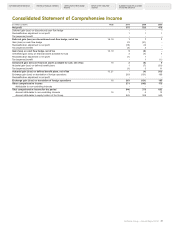
CONSOLIDATED BALANCE SHEET CONSOLIDATED INCOME
STATEMENT CONSOLIDATED STATEMENT
OF COMPREHENSIVE INCOME
CONSOLIDATED STATEMENT
OF CHANGES IN EQUITY
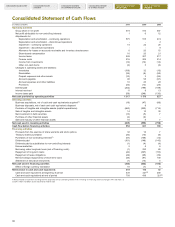
CONSOLIDATED STATEMENT
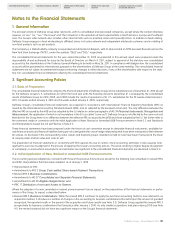
OF CASH FLOWS NOTES TO THE FINANCIAL
STATEMENTS
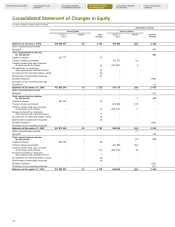
Consolidated Statement of Changes in Equity
(in millions of EUR, except number of shares)
Attributable to Equity Holders of the Group
Issued Capital Treasury Shares
Number of Amount Share Number of Amount Retained
Shares Premium Shares Earnings
Balances at January 1, 2008 100 280 507 50 2 709 938 949 (59) 2 355
Other comprehensive income - - - - - -
Net profit - - - - - 467
Total comprehensive income
for the period - - - - - 467
Capital increases 302 777 - 15 - - -
Treasury shares purchased - - - 123 317 (6) -
Treasury shares sold upon exercise
of employee stock options - - (8) (147 550) 9 -
Tax deficiency on employee
stock options and restricted shares - - (3) - - -
Tax payment for restricted shares vested - - (9) - - -
Share-based compensation expense - - 21 - - -
Dividend declared - - - - - (143)
Purchase of non-controlling interests - - - - - -
Divestiture - - - - - (1)
Balances at December 31, 2008 100 583 284 50 2 725 914 716 (56) 2 678
Other comprehensive income - - - - 1 -
Net profit - - - - - 514
Total comprehensive income
for the period - - - - 1 514
Capital increases 287 342 - 14 - - -
Treasury shares purchased - - - 205 882 (10) -
Treasury shares sold upon exercise
of employee stock options - - (7) (165 012) 11 -
Excess tax benefit on employee
stock options and restricted shares - - 2 - - -
Tax payment for restricted shares vested - - (2) - - -
Share-based compensation expense - - 20 - - -
Dividend declared - - - - - (148)
Purchase of non-controlling interests - - - - - -
Balances at December 31, 2009 100 870 626 50 2 752 955 586 (54) 3 044
Other comprehensive income - - - - (1) -
Net profit - - - - - 574
Total comprehensive income
for the period - - - - (1) 574
Capital increases 684 655 1 25 - - -
Treasury shares purchased - - - 441 996 (26) -
Treasury shares sold upon exercise
of employee stock options - - (11) (408 722) 22 -
Excess tax benefit on employee
stock options and restricted shares - - 1 - - -
Tax payment for restricted shares vested - - (5) - - -
Share-based compensation expense - - 16 - - -
Dividend declared - - - - - (161)
Purchase of non-controlling interests - - - - - (31)
Balances at December 31, 2010 101 555 281 51 2 778 988 860 (59) 3 426