Food Lion 2010 Annual Report Download - page 159
Download and view the complete annual report
Please find page 159 of the 2010 Food Lion annual report below. You can navigate through the pages in the report by either clicking on the pages listed below, or by using the keyword search tool below to find specific information within the annual report.-
 1
1 -
2
-
3
-
4
-
5
-
6
-
7
-
8
-
9
-
10
-
11
-
12
-
13
-
14
-
15
-
16
-
17
-
18
-
19
-
20
-
21
-
22
-
23
-
24
-
25
-
26
-
27
-
28
-
29
-
30
-
31
-
32
-
33
-
34
-
35
-
36
-
37
-
38
-
39
-
40
-
41
-
42
-
43
-
44
-
45
-
46
-
47
-
48
-
49
-
50
-
51
-
52
-
53
-
54
-
55
-
56
-
57
-
58
-
59
-
60
-
61
-
62
-
63
-
64
-
65
-
66
-
67
-
68
-
69
-
70
-
71
-
72
-
73
-
74
-
75
-
76
-
77
-
78
-
79
-
80
-
81
-
82
-
83
-
84
-
85
-
86
-
87
-
88
-
89
-
90
-
91
-
92
-
93
-
94
-
95
-
96
-
97
-
98
-
99
-
100
-
101
-
102
-
103
-
104
-
105
-
106
-
107
-
108
-
109
-
110
-
111
-
112
-
113
-
114
-
115
-
116
-
117
-
118
-
119
-
120
-
121
-
122
-
123
-
124
-
125
-
126
-
127
-
128
-
129
-
130
-
131
-
132
-
133
-
134
-
135
-
136
-
137
-
138
-
139
-
140
-
141
-
142
-
143
-
144
-
145
-
146
-
147
-
148
-
 149
149 -
 150
150 -
 151
151 -
 152
152 -
 153
153 -
 154
154 -
 155
155 -
 156
156 -
 157
157 -
 158
158 -
 159
159 -
 160
160 -
 161
161 -
 162
162
 |
 |

DELHAIZE GROUP
AT A GLANCE OUR
STRATEGY OUR ACTIVITIES
IN 2010
CORPORATE
GOVERNANCE STATEMENT
RISK
FACTORS FINANCIAL
STATEMENTS SHAREHOLDER
INFORMATION
Delhaize Group - Annual Report 2010 155
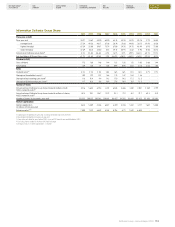
Information Delhaize Group Share
2010 2009 2008 2007 2006 2005 2004 2003 2002 2001
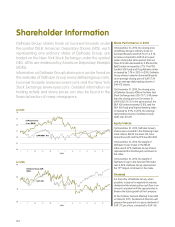
Share price (in EUR)
Price: year-end 55.27 53.62 44.20 60.20 63.15 55.20 55.95 40.78 17.72 58.45
average (close) 57.24 49.26 46.37 67.38 58.14 51.68 44.98 28.15 39.93 61.28
highest (intraday) 67.29 55.00 59.67 75.79 67.00 59.70 59.75 43.99 61.10 72.00
lowest (intraday) 47.69 42.81 32.80 54.5 49.12 45.95 36.61 11.90 15.00 48.72
Annual return Delhaize Group share(1) 5.3% 23.8% -26.6% -4.7% 16.1% 0.7%
39.9%
136.3% -69.1% 17.2%
Evolution Belgian All Shares Return index +2.7% +31.6% -47.6% -1.9% +26.2% +28.1% +38.2% +16.0% -22.5% -4.9%
Dividend (in EUR)
Gross dividend 1.72 1.60 1.48 1.44 1.32 1.20 1.12 1.00 0.88 1.44
Net dividend 1.29 1.20 1.11 1.08 0.99 0.90 0.84 0.75 0.66 1.08
Ratios
Dividend return(2) 2.3% 2.2% 2.5% 1.8% 1.6% 1.6% 1.5% 1.8% 3.7% 1.9%
Share price/shareholders' equity(3) 1.09 1.22 1.07 1.66 1.73 1.47 1.84 1.36 - -
Share price/basic earnings per share(3) 9.6 10.4 9.4 14.3 17.0 14.2 17.5 13.5 - -
Share price/diluted earnings per share(3) 9.7 10.6 9.6 14.9 17.8 14.9 18.1 13.5 - -
Number of Shares
AnnualvolumeofDelhaizeGroupsharestraded(inmillionsofEUR;
NYSEEuronext Brussels)(4) 5 216 5 633 6 754 8 141 6 548 3 686 3 581 2 021 2 569 3 199
AnnualvolumeofDelhaizeGroupsharestraded(inmillionsofshares;
NYSEEuronext Brussel)(4) 89.3 115.1 146.7 121.9 113.1 71.9 81.1 72.7 69.3 51.9
Numberofshares(inthousands;year-end) 101 555 100 871 100 583 100 281 96 457 94 705 93 669 92 625 92 393 92 393
Market Capitalization
Market capitalization
(inmillionsofEUR;year-end)
5 613 5 409 4 446 6 037 6 091 5 228 5 241 3 777 1 637 5 400
Enterprise value(3) (5) 7 400 7 472 6 849 8 281 8 726 8 171 7 849 6 805 - -
(1) Capital gains recorded during the year, including net dividend and reinvestment.
(2) Net dividend divided by share price at year-end.
(3) Cannot be calculated for years before 2003, since no IFRS financials are available before 2003.
(4) Excluding shares traded on the New York Stock Exchange.
(5) Enterprise value = market capitalization + net debt.