Food Lion 2010 Annual Report Download - page 40
Download and view the complete annual report
Please find page 40 of the 2010 Food Lion annual report below. You can navigate through the pages in the report by either clicking on the pages listed below, or by using the keyword search tool below to find specific information within the annual report.-
 1
1 -
2
-
3
-
4
-
5
-
6
-
7
-
8
-
9
-
10
-
11
-
12
-
13
-
14
-
15
-
16
-
17
-
18
-
19
-
20
-
21
-
22
-
23
-
24
-
25
-
26
-
27
-
28
-
29
-
 30
30 -
 31
31 -
 32
32 -
 33
33 -
 34
34 -
 35
35 -
 36
36 -
 37
37 -
 38
38 -
 39
39 -
 40
40 -
 41
41 -
 42
42 -
 43
43 -
 44
44 -
 45
45 -
 46
46 -
 47
47 -
 48
48 -
 49
49 -
 50
50 -
51
-
52
-
53
-
54
-
55
-
56
-
57
-
58
-
59
-
60
-
61
-
62
-
63
-
64
-
65
-
66
-
67
-
68
-
69
-
70
-
71
-
72
-
73
-
74
-
75
-
76
-
77
-
78
-
79
-
80
-
81
-
82
-
83
-
84
-
85
-
86
-
87
-
88
-
89
-
90
-
91
-
92
-
93
-
94
-
95
-
96
-
97
-
98
-
99
-
100
-
101
-
102
-
103
-
104
-
105
-
106
-
107
-
108
-
109
-
110
-
111
-
112
-
113
-
114
-
115
-
116
-
117
-
118
-
119
-
120
-
121
-
122
-
123
-
124
-
125
-
126
-
127
-
128
-
129
-
130
-
131
-
132
-
133
-
134
-
135
-
136
-
137
-
138
-
139
-
140
-
141
-
142
-
143
-
144
-
145
-
146
-
147
-
148
-
149
-
150
-
151
-
152
-
153
-
154
-
155
-
156
-
157
-
158
-
159
-
160
-
161
-
162
 |
 |
36
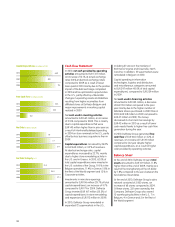
Cash Flow Statement
In 2010, net cash provided by operating
activities amounted to EUR 1 317 million,
an increase of 12.1% at actual exchange
rates (8.6% at identical exchange rates)
compared to 2009 as a result of lower
taxes paid in 2010 mainly due to the positive
impact of the debt exchange completed
in 2010 and tax optimization opportunities
in the U.S., partly offset by unfavorable
changes in operating assets and liabilities
resulting from higher receivables from
affiliated stores at Delhaize Belgium and
major improvements in working capital
realized in 2009.
Net cash used in investing activities
amounted to EUR 665 million, an increase
of 19.6% compared to 2009. This is mainly
due to capital expenditures that were
EUR 140 million higher than in prior year as
a result of intentionally delayed spending
in 2009 on store renewals in the U.S., partly
offset by less business acquisitions than in
2009.
Capital expenditures increased by 26.8%
to EUR 660 million, or 3.2% of revenues.
At identical exchange rates, capital
expenditures increased by 22.7%, mainly
due to higher store remodeling activity in
the U.S. and in Greece. In 2010, 62.0% of
total capital expenditures were invested in
the U.S. activities of the Group, 19.5% in the
Belgian operations, 11.4% in Greece; 5.8% in
the Rest of the World segment and 1.3% in
Corporate activities.
Investments in new store openings
amounted to EUR 196 million (29.7% of total
capital expenditures), an increase of 9.7%
compared to EUR 179 in 2009. Delhaize
Group invested EUR 167 million (25.3% of
capital expenditures) in store remodeling
and expansions (EUR 112 million in 2009).
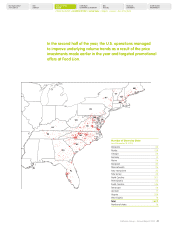
In 2010, Delhaize Group remodeled or
expanded 72 supermarkets in the U.S.,
including 31 stores in the markets of
Richmond, Virginia and Greenville, North
Carolina. In addition, 18 supermarkets were
remodeled in Belgium in 2010.
Capital spending in information
technologies, logistics and distribution,
and miscellaneous categories amounted
to EUR 297 million (45.0% of total capital
expenditures), compared to EUR 229 million
in 2009.
Net cash used in financing activities
amounted to EUR 343 million, a decrease
of EUR 153 million compared to the prior
year mainly due to the higher number of
Alfa Beta shares purchased in 2009 than in
2010 (EUR 108 million in 2009 compared to
EUR 47 million in 2010). The Group
decreased its short-term borrowings by
EUR 42 million in 2010 as a result of lower
cash needs thanks to higher free cash flow
generation during the year.
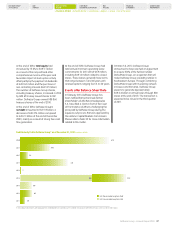
In 2010, Delhaize Group generated free
cash flow of EUR 665 million or 3.2% of
revenues, an increase of EUR 39 million
compared to last year despite higher
capital expenditures, as a result of higher
cash provided by operating activities.
Balance Sheet
At the end of 2010, Delhaize Group’s total
assets amounted to EUR 10.9 billion, 11.8%
higher than at the end of 2009, mainly as a
result of the strengthening of the US dollar
by 7.8% compared to the euro between the
two balance sheet dates.
At the end of 2010, Delhaize Group’s sales
network consisted of 2 800 stores, an
increase of 68 stores compared to 2009.
Of these stores, 331 were owned by the
Company. Delhaize Group also owned
12 warehousing facilities in the U.S., 7 in
Belgium, 4 in Greece and 2 in the Rest of
the World segment.
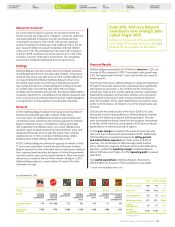
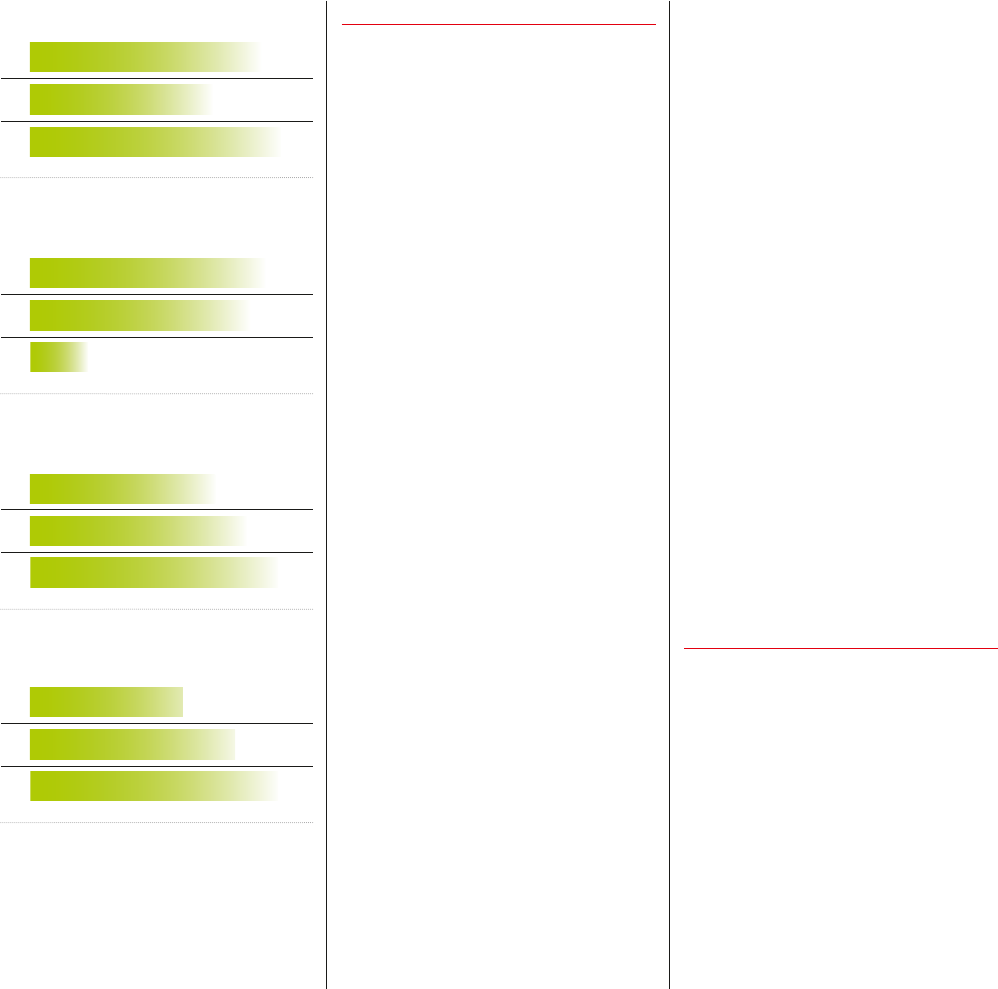
Capital Expenditures (in millions of EUR)
Free Cash Flow (in millions of EUR)
Net Debt (in billions of EUR)
Net Debt to Equity (in %)
2008
2008
2008
2008
2009
2009
2009
2009
2010
2010
2010
2010
714
162
2.4
57.3
660
665
1.8
35.3
520
626
2.1
46.8