Food Lion 2010 Annual Report Download - page 147
Download and view the complete annual report
Please find page 147 of the 2010 Food Lion annual report below. You can navigate through the pages in the report by either clicking on the pages listed below, or by using the keyword search tool below to find specific information within the annual report.-
 1
1 -
2
-
3
-
4
-
5
-
6
-
7
-
8
-
9
-
10
-
11
-
12
-
13
-
14
-
15
-
16
-
17
-
18
-
19
-
20
-
21
-
22
-
23
-
24
-
25
-
26
-
27
-
28
-
29
-
30
-
31
-
32
-
33
-
34
-
35
-
36
-
37
-
38
-
39
-
40
-
41
-
42
-
43
-
44
-
45
-
46
-
47
-
48
-
49
-
50
-
51
-
52
-
53
-
54
-
55
-
56
-
57
-
58
-
59
-
60
-
61
-
62
-
63
-
64
-
65
-
66
-
67
-
68
-
69
-
70
-
71
-
72
-
73
-
74
-
75
-
76
-
77
-
78
-
79
-
80
-
81
-
82
-
83
-
84
-
85
-
86
-
87
-
88
-
89
-
90
-
91
-
92
-
93
-
94
-
95
-
96
-
97
-
98
-
99
-
100
-
101
-
102
-
103
-
104
-
105
-
106
-
107
-
108
-
109
-
110
-
111
-
112
-
113
-
114
-
115
-
116
-
117
-
118
-
119
-
120
-
121
-
122
-
123
-
124
-
125
-
126
-
127
-
128
-
129
-
130
-
131
-
132
-
133
-
134
-
135
-
136
-
 137
137 -
 138
138 -
 139
139 -
 140
140 -
 141
141 -
 142
142 -
 143
143 -
 144
144 -
 145
145 -
 146
146 -
 147
147 -
 148
148 -
 149
149 -
 150
150 -
 151
151 -
 152
152 -
 153
153 -
 154
154 -
 155
155 -
 156
156 -
 157
157 -
158
-
159
-
160
-
161
-
162
 |
 |

Delhaize Group - Annual Report 2010 143
SUPPLEMENTARY INFORMATION
HISTORICAL FINANCIAL OVERVIEW CERTIFICATION OF RESPONSIBLE
PERSONS REPORT OF THE STATUTORY
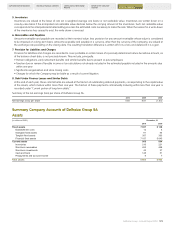
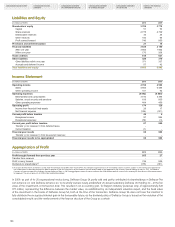
AUDITOR SUMMARY STATUTORY ACCOUNTS
OF DELHAIZE GROUP SA
Supplementary Information
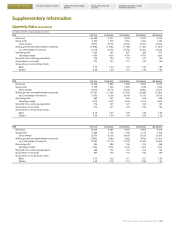
Quarterly Data (Unaudited)
(in millions of EUR, except earnings per share)
2010 Full Year 1st Quarter 2nd Quarter 3rd Quarter 4th Quarter
Revenues 20 850 4 971 5 329 5 307 5 243
Gross profit 5 353 1 275 1 357 1 364 1 357
Gross margin 25.7% 25.7% 25.5% 25.7% 25.9%
Selling, general and administrative expenses (4 394) (1 056) (1 148) (1 127) (1 063)
as a percentage of revenues 21.1% 21.2% 21.5% 21.2% 20.3%
Operating profit 1 024 241 227 249 307
Operating margin 4.9% 4.8% 4.3% 4.7% 5.9%
Net profit from continuing operations 576 130 115 141 190
Group share in net profit 574 130 114 140 190
Group share in net profit per share:
Basic 5.73 1.29 1.15 1.40 1.88
Diluted 5.68 1.28 1.13 1.39 1.87
2009 Full Year 1st Quarter 2nd Quarter 3rd Quarter 4th Quarter
Revenues 19 938 5 089 5 088 4 888 4 873
Gross profit 5 125 1 329 1 293 1 249 1 254
Gross margin 25.7% 26.1% 25.4% 25.6% 25.7%
Selling, general and administrative expenses (4 192) (1 094) (1 061) (1 029) (1 008)
as a percentage of revenues 21.0% 21.5% 20.8% 21.1% 20.7%
Operating profit 942 247 244 228 223
Operating margin 4.7% 4.9% 4.8% 4.7% 4.6%
Net profit from continuing operations 512 127 127 122 136
Group share in net profit 514 127 125 128 134
Group share in net profit per share:
Basic 5.16 1.27 1.26 1.28 1.35
Diluted 5.08 1.24 1.24 1.26 1.34
2008 Full Year 1st Quarter 2nd Quarter 3rd Quarter 4th Quarter
Revenues 19 024 4 494 4 450 4 662 5 418
Gross profit 4 820 1 136 1 109 1 172 1 403
Gross margin 25.3% 25.3% 24.9% 25.1% 25.9%
Selling, general and administrative expenses (3 962) (949) (932) (978) (1 103)
as a percentage of revenues 20.8% 21.1% 21.0% 21.0% 20.4%
Operating profit 904 206 194 215 289
Operating margin 4.8% 4.6% 4.4% 4.6% 5.3%
Net profit from continuing operations 485 105 113 103 164
Group share in net profit 467 102 116 100 149
Group share in net profit per share:
Basic 4.70 1.02 1.17 1.01 1.50
Diluted 4.59 1.00 1.14 0.98 1.46