Food Lion 2010 Annual Report Download - page 79
Download and view the complete annual report
Please find page 79 of the 2010 Food Lion annual report below. You can navigate through the pages in the report by either clicking on the pages listed below, or by using the keyword search tool below to find specific information within the annual report.-
 1
1 -
2
-
3
-
4
-
5
-
6
-
7
-
8
-
9
-
10
-
11
-
12
-
13
-
14
-
15
-
16
-
17
-
18
-
19
-
20
-
21
-
22
-
23
-
24
-
25
-
26
-
27
-
28
-
29
-
30
-
31
-
32
-
33
-
34
-
35
-
36
-
37
-
38
-
39
-
40
-
41
-
42
-
43
-
44
-
45
-
46
-
47
-
48
-
49
-
50
-
51
-
52
-
53
-
54
-
55
-
56
-
57
-
58
-
59
-
60
-
61
-
62
-
63
-
64
-
65
-
66
-
67
-
68
-
 69
69 -
 70
70 -
 71
71 -
 72
72 -
 73
73 -
 74
74 -
 75
75 -
 76
76 -
 77
77 -
 78
78 -
 79
79 -
 80
80 -
 81
81 -
 82
82 -
 83
83 -
 84
84 -
 85
85 -
 86
86 -
 87
87 -
 88
88 -
 89
89 -
90
-
91
-
92
-
93
-
94
-
95
-
96
-
97
-
98
-
99
-
100
-
101
-
102
-
103
-
104
-
105
-
106
-
107
-
108
-
109
-
110
-
111
-
112
-
113
-
114
-
115
-
116
-
117
-
118
-
119
-
120
-
121
-
122
-
123
-
124
-
125
-
126
-
127
-
128
-
129
-
130
-
131
-
132
-
133
-
134
-
135
-
136
-
137
-
138
-
139
-
140
-
141
-
142
-
143
-
144
-
145
-
146
-
147
-
148
-
149
-
150
-
151
-
152
-
153
-
154
-
155
-
156
-
157
-
158
-
159
-
160
-
161
-
162
 |
 |
SUPPLEMENTARY INFORMATION HISTORICAL FINANCIAL OVERVIEW CERTIFICATION OF RESPONSIBLE
PERSONS REPORT OF THE STATUTORY
AUDITOR SUMMARY STATUTORY ACCOUNTS
OF DELHAIZE GROUP SA
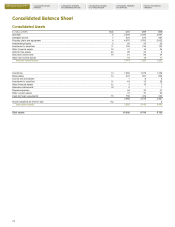
Delhaize Group - Annual Report 2010 75
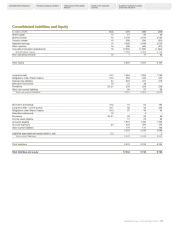
Consolidated Liabilities and Equity
(in millions of EUR) Note 2010 2009 2008
Share capital 16 51 50 50
Share premium 16 2 778 2 752 2 725
Treasury shares 16 (59) (54) (56)
Retained earnings 16 3 426 3 044 2 678
Other reserves 16 (34) (40) (25)
Cumulative translation adjustments 16 (1 094) (1 360) (1 229)
Shareholders’ equity 5 068 4 392 4 143
Non-controlling interests 16 1 17 52
Total equity 5 069 4 409 4 195
Long-term debt 18.1 1 966 1 904 1 766
Obligations under finance leases 18.3 684 643 643
Deferred tax liabilities 22 543 227 215
Derivative instruments 19 16 38 -
Provisions 20, 21 233 228 226
Other non-current liabilities 68 57 68
Total non-current liabilities 3 510 3 097 2 918
Short-term borrowings 18.2 16 63 152
Long-term debt - current portion 18.1 40 42 326
Obligations under finance leases 18.3 57 44 44
Derivative instruments 19 - 2 -
Provisions 20, 21 52 52 49
Income taxes payable 17 65 98
Accounts payable 1 574 1 436 1 383
Accrued expenses 23 393 397 378
Other current liabilities 174 141 154
2 323 2 242 2 584
Liabilities associated with assets held for sale 5.2 - - 3
Total current liabilities 2 323 2 242 2 587
Total liabilities 5 833 5 339 5 505
Total liabilities and equity 10 902 9 748 9 700