Food Lion 2010 Annual Report Download - page 134
Download and view the complete annual report
Please find page 134 of the 2010 Food Lion annual report below. You can navigate through the pages in the report by either clicking on the pages listed below, or by using the keyword search tool below to find specific information within the annual report.-
 1
1 -
2
-
3
-
4
-
5
-
6
-
7
-
8
-
9
-
10
-
11
-
12
-
13
-
14
-
15
-
16
-
17
-
18
-
19
-
20
-
21
-
22
-
23
-
24
-
25
-
26
-
27
-
28
-
29
-
30
-
31
-
32
-
33
-
34
-
35
-
36
-
37
-
38
-
39
-
40
-
41
-
42
-
43
-
44
-
45
-
46
-
47
-
48
-
49
-
50
-
51
-
52
-
53
-
54
-
55
-
56
-
57
-
58
-
59
-
60
-
61
-
62
-
63
-
64
-
65
-
66
-
67
-
68
-
69
-
70
-
71
-
72
-
73
-
74
-
75
-
76
-
77
-
78
-
79
-
80
-
81
-
82
-
83
-
84
-
85
-
86
-
87
-
88
-
89
-
90
-
91
-
92
-
93
-
94
-
95
-
96
-
97
-
98
-
99
-
100
-
101
-
102
-
103
-
104
-
105
-
106
-
107
-
108
-
109
-
110
-
111
-
112
-
113
-
114
-
115
-
116
-
117
-
118
-
119
-
120
-
121
-
122
-
123
-
 124
124 -
 125
125 -
 126
126 -
 127
127 -
 128
128 -
 129
129 -
 130
130 -
 131
131 -
 132
132 -
 133
133 -
 134
134 -
 135
135 -
 136
136 -
 137
137 -
 138
138 -
 139
139 -
 140
140 -
 141
141 -
 142
142 -
 143
143 -
 144
144 -
145
-
146
-
147
-
148
-
149
-
150
-
151
-
152
-
153
-
154
-
155
-
156
-
157
-
158
-
159
-
160
-
161
-
162
 |
 |

130
CONSOLIDATED BALANCE SHEET CONSOLIDATED INCOME
STATEMENT CONSOLIDATED STATEMENT
OF COMPREHENSIVE INCOME CONSOLIDATED STATEMENT
OF CHANGES IN EQUITY CONSOLIDATED STATEMENT
OF CASH FLOWS
NOTES TO THE FINANCIAL
STATEMENTS
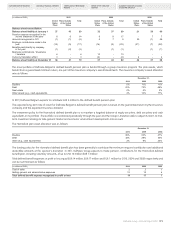
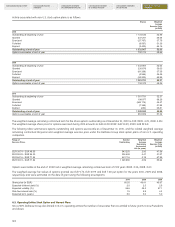
TheweightedaverageremainingcontractualtermfortheshareoptionsoutstandingasatDecember31,2010is5.52(2009:6.18;2008:6.67).
Theweightedaveragesharepriceforoptionsexercisedduring2010amountstoUSD79.22(2009:USD72.21;2008:USD76.14).
The following table summarizes options and warrants outstanding as of December 31, 2010, and the related weighted average remaining
contractual life (years) and weighted average exercise price under the stock option plans for associates of U.S. operating companies:
Range of Number Weighted Weighted
Exercise Prices Outstanding Average Average
Remaining Exercise Price
Contractual (in USD)
Life (in years)
USD 28.91 - USD 51.12 587 203 2.26 43.39
USD 60.76 - USD 74.76 1 510 088 5.84 67.01
USD 77.92 - USD 96.30 1 215 835 6.68 92.86
USD 28.91 - USD 96.30 3 313 126 5.52 72.31
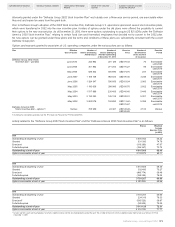
Optionsexercisableattheendof2010hadaweightedaverageremainingcontractualtermof4.90years(2009:5.40;2008:5.49).
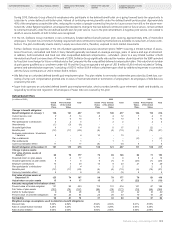
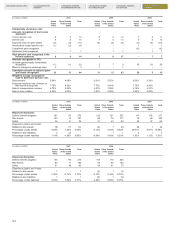
The weighted average fair values of options granted were USD 13.03, USD 12.88 and USD 14.35 per option for the years 2010, 2009 and 2008,
respectively and were estimated using the following weighted average assumptions:
2010 2009 2008
Share price (in USD) 78.33 70.27 74.76
Expected dividend yield (%) 2.5 2.6 2.4
Expected volatility (%) 25.2 26.3 25.7
Risk-free interest rate (%) 1.6 2.3 3.2
Expected term (years) 4.0 4.0 3.9
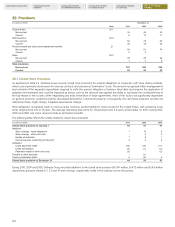
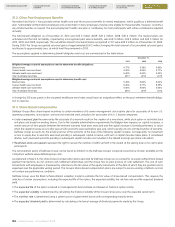
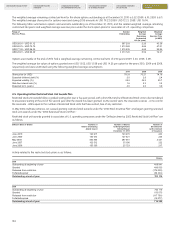
U.S. Operating Entities Restricted Stock Unit Awards Plan
Restricted stock unit awards follow a graded vesting plan over a five-year period, with a first 25% tranche of Restricted Stock Units to be transferred
to associates starting at the end of the second year after the award has been granted. As the award vests, the associate receives - at no cost for
the associate - ADRs equal to the number of Restricted Stock Units that have vested, free of any restriction.
In May 2002, Delhaize America, LLC ceased granting restricted stock awards under the "2000 Stock Incentive Plan" and began granting restricted
stock unit awards under the "2002 Restricted Stock Unit Plan."
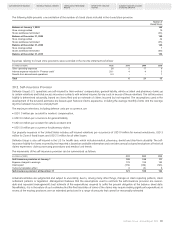
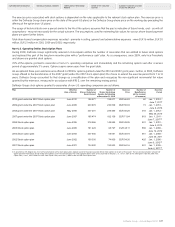
Restricted stock unit awards granted to associates of U.S. operating companies under the “Delhaize America 2002 Restricted Stock Unit Plan” are
as follows:
Effective Date of Grants Number of Number of Shares Number of
Shares Underlying Underlying Awards Beneficiaries
Award Issued Outstanding at (at the moment
December 31, 2010 of issuance)
June 2010 123 917 120 270 243
June 2009 150 073 127 821 245
May 2008 466 503 287 661 3 421
June 2007 102 512 35 636 222
June 2006 155 305 25 723 217
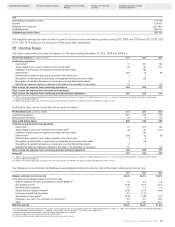
Activity related to the restricted stock plans is as follows:
Shares
2008
Outstanding at beginning of year 468 941
Granted 466 503
Released from restriction (174 000)
Forfeited/expired (58 334)
Outstanding at end of year 703 110
2009
Outstanding at beginning of year 703 110
Granted 150 073
Released from restriction (117 756)
Forfeited/expired (19 077)
Outstanding at end of year 716 350