Food Lion 2010 Annual Report Download - page 153
Download and view the complete annual report
Please find page 153 of the 2010 Food Lion annual report below. You can navigate through the pages in the report by either clicking on the pages listed below, or by using the keyword search tool below to find specific information within the annual report.-
 1
1 -
2
-
3
-
4
-
5
-
6
-
7
-
8
-
9
-
10
-
11
-
12
-
13
-
14
-
15
-
16
-
17
-
18
-
19
-
20
-
21
-
22
-
23
-
24
-
25
-
26
-
27
-
28
-
29
-
30
-
31
-
32
-
33
-
34
-
35
-
36
-
37
-
38
-
39
-
40
-
41
-
42
-
43
-
44
-
45
-
46
-
47
-
48
-
49
-
50
-
51
-
52
-
53
-
54
-
55
-
56
-
57
-
58
-
59
-
60
-
61
-
62
-
63
-
64
-
65
-
66
-
67
-
68
-
69
-
70
-
71
-
72
-
73
-
74
-
75
-
76
-
77
-
78
-
79
-
80
-
81
-
82
-
83
-
84
-
85
-
86
-
87
-
88
-
89
-
90
-
91
-
92
-
93
-
94
-
95
-
96
-
97
-
98
-
99
-
100
-
101
-
102
-
103
-
104
-
105
-
106
-
107
-
108
-
109
-
110
-
111
-
112
-
113
-
114
-
115
-
116
-
117
-
118
-
119
-
120
-
121
-
122
-
123
-
124
-
125
-
126
-
127
-
128
-
129
-
130
-
131
-
132
-
133
-
134
-
135
-
136
-
137
-
138
-
139
-
140
-
141
-
142
-
 143
143 -
 144
144 -
 145
145 -
 146
146 -
 147
147 -
 148
148 -
 149
149 -
 150
150 -
 151
151 -
 152
152 -
 153
153 -
 154
154 -
 155
155 -
 156
156 -
 157
157 -
 158
158 -
 159
159 -
 160
160 -
 161
161 -
 162
162
 |
 |

Delhaize Group - Annual Report 2010 149
SUPPLEMENTARY INFORMATION HISTORICAL FINANCIAL OVERVIEW CERTIFICATION OF RESPONSIBLE
PERSONS REPORT OF THE STATUTORY
AUDITOR
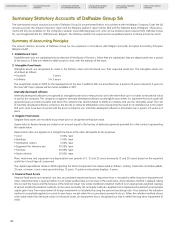
SUMMARY STATUTORY ACCOUNTS
OF DELHAIZE GROUP SA
5. Inventories
Inventories are valued at the lower of cost (on a weighted average cost basis) or net realizable value. Inventories are written down on a
case-by-case basis if the anticipated net realizable value declines below the carrying amount of the inventories. Such net realizable value
corresponds to the anticipated estimated selling price less the estimated costs necessary to make the sale. When the reason for a write-down
of the inventories has ceased to exist, the write-down is reversed.
6. Receivables and Payables
Amounts receivable and payable are recorded at their nominal value, less provision for any amount receivable whose value is considered
to be impaired on a long-term basis. Amounts receivable and payable in a currency, other than the currency of the Company, are valued at
the exchange rate prevailing on the closing date. The resulting translation difference is written off if it is a loss and deferred if it is a gain.
7. Provision for Liabilities and Charges
Provision for liabilities and charges are recorded to cover probable or certain losses of a precisely determined nature but whose amount, as
of the balance sheet date, is not precisely known. They include, principally:
•Pensionobligations,earlyretirementbenefitsandsimilarbenefitsduetopresentorpastemployees
•Taxationdueonreviewoftaxableincomeortaxcalculationsnotalreadyincludedintheestimatedpayableincludedintheamountsdue
within one year
•Significantreorganizationandstoreclosingcosts
•ChargesforwhichtheCompanymaybeliableasaresultofcurrentlitigation.
8. Debt Under Finance Leases and Similar Debts
At the end of each year, these commitments are valued at the fraction of outstanding deferred payments, corresponding to the capital value
of the assets, which mature within more than one year. The fraction of these payments contractually maturing within less than one year is
recorded under “Current portion of long-term debts.”
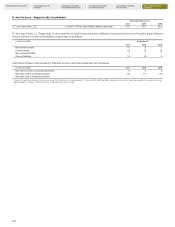
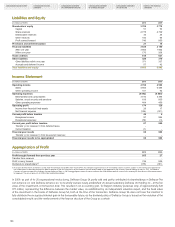
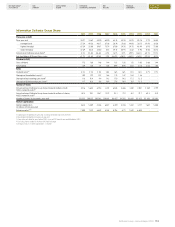
Summary of the net earnings (loss) per share of Delhaize Group SA:
2010 2009 2008
Net earnings (loss) per share 0.65 9.81 (1.53)
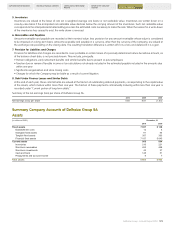
Summary Company Accounts of Delhaize Group SA
Assets
(in millions of EUR) December, 31
2010 2009
Fixed assets 7 697 6 138
Establishment costs 12 6
Intangible fixed assets 111 94
Tangible fixed assets 387 393
Financial fixed assets 7 187 5 645
Current assets 908 804
Inventories 216 221
Short-term receivables 493 488
Short-term investments 42 37
Cash and bank 148 51
Prepayments and accrued income 9 7
Total assets 8 605 6 942