Food Lion 2010 Annual Report Download - page 3
Download and view the complete annual report
Please find page 3 of the 2010 Food Lion annual report below. You can navigate through the pages in the report by either clicking on the pages listed below, or by using the keyword search tool below to find specific information within the annual report.-
 1
1 -
 2
2 -
 3
3 -
 4
4 -
 5
5 -
 6
6 -
 7
7 -
 8
8 -
 9
9 -
 10
10 -
 11
11 -
 12
12 -
 13
13 -
 14
14 -
15
-
16
-
17
-
18
-
19
-
20
-
21
-
22
-
23
-
24
-
25
-
26
-
27
-
28
-
29
-
30
-
31
-
32
-
33
-
34
-
35
-
36
-
37
-
38
-
39
-
40
-
41
-
42
-
43
-
44
-
45
-
46
-
47
-
48
-
49
-
50
-
51
-
52
-
53
-
54
-
55
-
56
-
57
-
58
-
59
-
60
-
61
-
62
-
63
-
64
-
65
-
66
-
67
-
68
-
69
-
70
-
71
-
72
-
73
-
74
-
75
-
76
-
77
-
78
-
79
-
80
-
81
-
82
-
83
-
84
-
85
-
86
-
87
-
88
-
89
-
90
-
91
-
92
-
93
-
94
-
95
-
96
-
97
-
98
-
99
-
100
-
101
-
102
-
103
-
104
-
105
-
106
-
107
-
108
-
109
-
110
-
111
-
112
-
113
-
114
-
115
-
116
-
117
-
118
-
119
-
120
-
121
-
122
-
123
-
124
-
125
-
126
-
127
-
128
-
129
-
130
-
131
-
132
-
133
-
134
-
135
-
136
-
137
-
138
-
139
-
140
-
141
-
142
-
143
-
144
-
145
-
146
-
147
-
148
-
149
-
150
-
151
-
152
-
153
-
154
-
155
-
156
-
157
-
158
-
159
-
160
-
161
-
162
 |
 |
6
(USD
in millions
except
per share
amounts)
(4)
(EUR in millions
except per
share amounts)
Change vs
Prior Year
2010 2010 2009 2008 2010 2009
Results
Revenues
27 641 20 850 19 938 19 024 4.6% 4.8%
Operating profit
1 358 1 024 942 904 8.7% 4.2%
Net profit from continuing operations
764 576 512 485 12.5% 5.5%
Net profit (Group share)
762 574 514 467 11.7% 10.1%
Free cash flow(1)(5)
882 665 626 162 6.5% 286.2%
Financial position
Total assets
14 453 10 902 9 748 9 700 11.8% 0.5%
Total equity
6 720 5 069 4 409 4 195 15.0% 5.1%
Net debt(1)
2 369 1 787 2 063 2 402 -13.4% -14.1%
Enterprise value(1)(3)
9 810 7 400 7 472 6 849 -1.0% 9.1%
Per share information (in EUR)
Group share in net profit (basic)(2)
7.60 5.73 5.16 4.70 11.2% 9.6%
Group share in net profit (diluted)(2)
7.53 5.68 5.08 4.59 11.7% 10.8%
Free cash flow(1)(2)(5)
8.80 6.64 6.26 1.63 6.0% 284.6%
Net dividend
1.71 1.29 1.20 1.11 7.5% 8.1%
Shareholders’ equity(3)
66.17 49.91 43.54 41.19 14.6% 5.7%
Share price (year-end)
73.27 55.27 53.62 44.20 3.1% 21.3%
Ratios (%)
Operating margin
4.9% 4.7% 4.8% +19bps -3bps
Net margin
2.8% 2.6% 2.5% +18bps 12bps
Net debt to equity(1)
35.3% 46.8% 57.3% -115ppt -105ppt
Currency information
Average EUR per USD rate
0.7543 0.7169 0.6799 5.2% 5.4%
EUR per USD rate at year-end
0.7484 0.6942 0.7185 7.8% -3.4%
Other information
Number of sales outlets
2 800 2 732 2 673 2.5% 2.2%
Capital expenditures
660 520 714 26.8% -27.1%
Number of associates (thousands)
138 138 141 -0.7% -2.0%
Full-time equivalents (thousands)
102 104 106 -1.5% -2.3%
Weighted average number of shares
(thousands)
100 271 99 803 99 385 0.5% 0.4%
(1) These are non-GAAP financial measures.
(2) Calculated using the weighted average number of shares over the year.
(3) Calculated using the total number of shares at the end of the year.
(4) Calculated using an exchange rate of 1 EUR = 1.3257 USD.
(5) Reclassification of cash flows resulting from the acquisition of non-controlling interests
from “Investing” to “Financing” due to a change in IFRS.
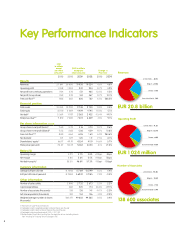
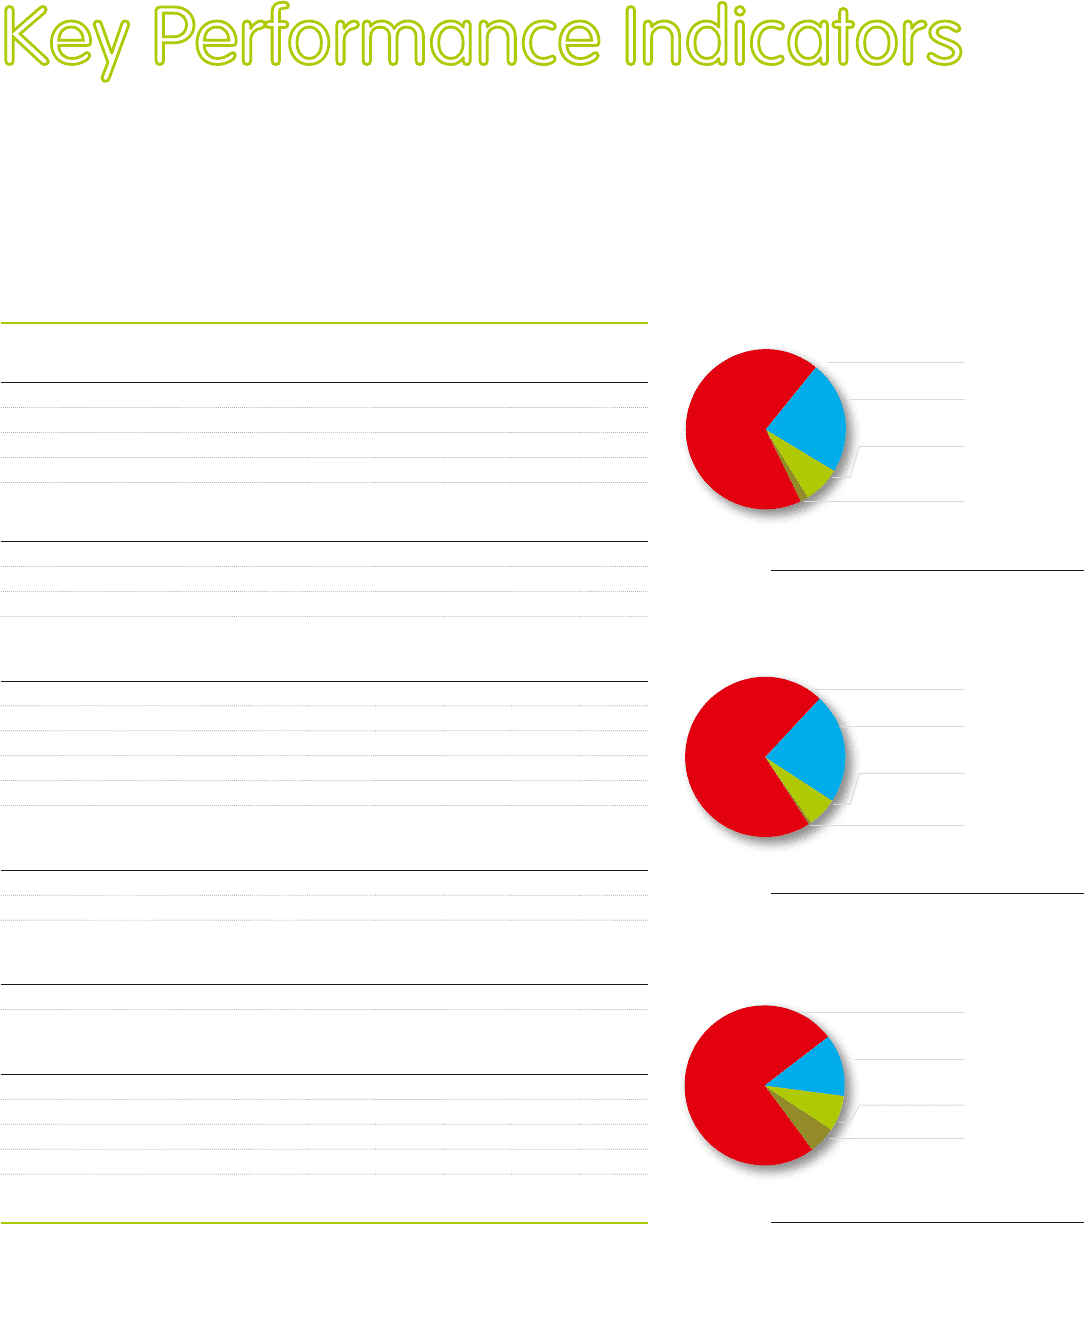
Key Performance Indicators
EUR 20.8 billion
United States - 68.1%
United States - 71.2%
Rest of the World - 1.4%
Rest of the World - 0.5%
Rest of the World - 5.4%
Greece - 7.5%
Greece - 6.0%
Belgium - 23.0%
Belgium - 22.3%
Revenues
EUR 1 024 million
Operating Profit
138 600
associates
United States - 74.8%
Greece - 7.2%
Belgium - 12.6%
Number of Associates