Food Lion 2004 Annual Report Download - page 66
Download and view the complete annual report
Please find page 66 of the 2004 Food Lion annual report below. You can navigate through the pages in the report by either clicking on the pages listed below, or by using the keyword search tool below to find specific information within the annual report.-
 1
1 -
2
-
3
-
4
-
5
-
6
-
7
-
8
-
9
-
10
-
11
-
12
-
13
-
14
-
15
-
16
-
17
-
18
-
19
-
20
-
21
-
22
-
23
-
24
-
25
-
26
-
27
-
28
-
29
-
30
-
31
-
32
-
33
-
34
-
35
-
36
-
37
-
38
-
39
-
40
-
41
-
42
-
43
-
44
-
45
-
46
-
47
-
48
-
49
-
50
-
51
-
52
-
53
-
54
-
55
-
 56
56 -
 57
57 -
 58
58 -
 59
59 -
 60
60 -
 61
61 -
 62
62 -
 63
63 -
 64
64 -
 65
65 -
 66
66 -
 67
67 -
 68
68 -
 69
69 -
 70
70 -
 71
71 -
 72
72 -
 73
73 -
 74
74 -
 75
75 -
 76
76 -
77
-
78
-
79
-
80
-
81
-
82
-
83
-
84
-
85
-
86
-
87
-
88
 |
 |

DELHAIZE GROUP ANNUAL REPORT 2004
64
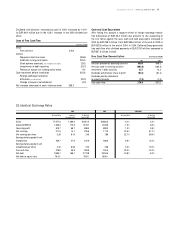
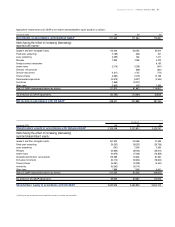
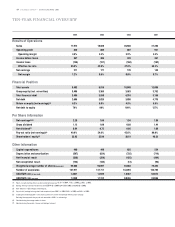
TENYEAR FINANCIAL OVERVIEW
2004 2003 2002 2001
Results of Operations
Sales 17,972 18,820 20,688 21,396
Operating profit 820 809 807 921
Operating margin 4.6% 4.3% 3.9% 4.3%
Income before taxes 367 306 339 361
Income taxes (145) (131) (160) (192)
Effective tax rate 39.5% 42.9% 47.0% 53.2%
Net earnings 211 171 178 149
Net margin 1.2% 0.9% 0.8% 0.7%
Financial Position
Total assets 9,403 9,519 10,840 12,086
Group equity (incl. minorities) 3,406 3,369 3,563 3,752
Total financial debt 3,406 3,550 4,316 5,168
Net debt 2,606 3,025 3,898 4,776
Return on equity (net earnings)
(1)
6.3% 5.0% 4.9% 5.9%
Net debt to equity 76% 90% 109% 127%
Per Share Information
Net earnings
(2)(6)
2.28 1.86 1.94 1.88
Gross dividend 1.12 1.00 0.88 1.44
Net dividend
(3)
0.84 0.75 0.66 1.08
Pay-out ratio (net earnings)
(4)
49.6% 54.6% 45.6% 89.0%
Shareholders’ equity
(7)
35.85 35.99 38.19 40.22
Other Information
Capital expenditures 490 448 635 554
Depreciation and amortization (587) (624) (725) (719)
Net financial result (330) (359) (455) (464)
Net exceptional result (123) (145) (13) (96)
Weighted average number of shares
(thousands)
92,663
92,097
92,068
79,494
Number of associates 137,911 141,711 143,894 146,785
USD/EUR rate
(at year-end)
1.3621 1.2629 1.0487 0.8813
USD/EUR rate
(average)
1.2439 1.1312 0.9456 0.8956
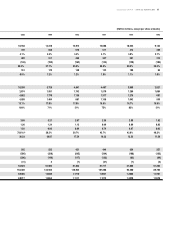
(1) Return on equity (earnings before goodw ill and exceptionals) was 12.2% in 2004, 11.3% in 2003 and 9.3% in 2002.
(2) Earnings before goodwill and exceptionals w ere EUR 4.42 in 2004, EUR 4.20 in 2003 and EUR 3.63 in 2002.
(3) After deduction of 25% Belgian withholding tax.
(
4) Pay-out ratio (earnings before goodw ill and exceptionals) was 25.6% in 2004, 24.2% in 2003 and 24.2% in 2002.
(5) Including the dividend payable to new shares issued in the context of the Delhaize America share exchange.
Excluding these payments, the pay-out ratio amounted to 44.6% on net earnings.
(6) Calculated using the average number of shares.
(7) Calculated using the number of shares outstanding at year-end.