Food Lion 2004 Annual Report Download - page 55
Download and view the complete annual report
Please find page 55 of the 2004 Food Lion annual report below. You can navigate through the pages in the report by either clicking on the pages listed below, or by using the keyword search tool below to find specific information within the annual report.-
 1
1 -
2
-
3
-
4
-
5
-
6
-
7
-
8
-
9
-
10
-
11
-
12
-
13
-
14
-
15
-
16
-
17
-
18
-
19
-
20
-
21
-
22
-
23
-
24
-
25
-
26
-
27
-
28
-
29
-
30
-
31
-
32
-
33
-
34
-
35
-
36
-
37
-
38
-
39
-
40
-
41
-
42
-
43
-
44
-
 45
45 -
 46
46 -
 47
47 -
 48
48 -
 49
49 -
 50
50 -
 51
51 -
 52
52 -
 53
53 -
 54
54 -
 55
55 -
 56
56 -
 57
57 -
 58
58 -
 59
59 -
 60
60 -
 61
61 -
 62
62 -
 63
63 -
 64
64 -
 65
65 -
66
-
67
-
68
-
69
-
70
-
71
-
72
-
73
-
74
-
75
-
76
-
77
-
78
-
79
-
80
-
81
-
82
-
83
-
84
-
85
-
86
-
87
-
88
 |
 |

DELHAIZE GROUP ANNUAL REPORT 2004 53
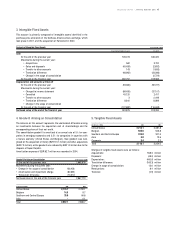
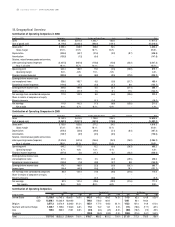
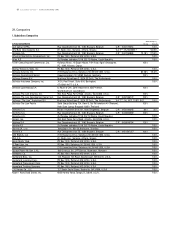
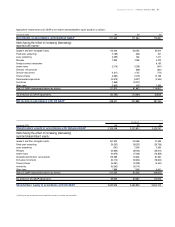
19. Organic Sales Grow th Reconciliation
(in millions of EUR) 2004 2003 %
Sales 17,971.6 18,820.5 -4.5%
Effect of exchange rates 1,289.6 -
Sales at identical exchange rates 19,261.2 18,820.5 +2.3%
Less Shop N Save
(1)
- (46.0)
Less Food Lion Thailand
(1)
(28.9) (54.5)
Less Harveys
(1)(2)
(278.6) (55.6)
Less Victory
(1)
(33.4) -
Less 53
rd
sales week in U.S.
(1)(3)
- (267.6)
Organic sales growth 18,920.3 18,396.8 +2.8%
(1)
At 2003 average exchange rates
(2) Harveys sales do not include the sales of the Food Lion stores converted to Harveys
(3) Excluding Harveys
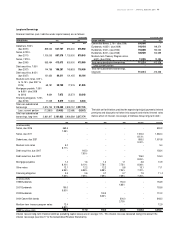
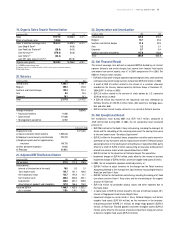
20. Salaries
(in millions of EUR) 2004 2003
United States 1,665.1 1,793.1
Belgium 495.4 472.0
Southern and Central Europe 132.3 121.4
Asia 8.6 13.6
Corporate 16.1 14.1
Total 2,317.5 2,414.2
Average w orkforce 138,048
• Hourly paid workers 11,586
• Salaried staff 117,680
• M anagement personnel 8,782
(in thousands of EUR)
Employment costs 2,317,465
a) Salaries and other direct benefits 1,893,610
b) Employer’s social security contributions 223,312
c) Employer’s premiums for supplementary
insurance 148,755
d) Other personnel expenses 14,965
e) Pensions 36,823
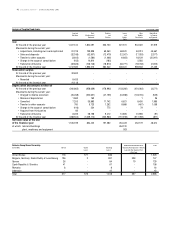
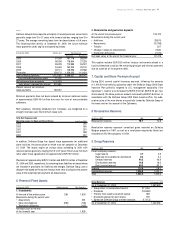
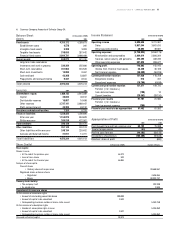
21. Adjusted EBITDA Reconciliation
(in millions of EUR) 2004 2003 2002
Net earnings 211.5 171.3 178.3
Add (subtract) :
Interest of third parties in the result 10.5 3.3 1.5
Total income taxes 144.7 131.1 159.6
Net exceptional result 122.7 144.9 12.7
Net financial result 330.3 358.6 455.1
Depreciation 438.8 467.2 548.8
Amortization of goodw ill and intangibles 147.8 156.6 176.2
Adjusted EBITDA 1,406.3 1,433.0 1,532.2
As % of sales 7.8% 7.6% 7.4%
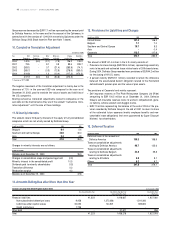
22. Depreciation and Amortization
(in millions of EUR) 2004 2003
United States 349.6 378.2
Belgium 53.7 53.6
Southern and Central Europe 31.6 29.9
Asia 3.2 5.1
Corporate 0.7 0.4
Goodwill and other intangibles 147.8 156.6
Total 586.6 623.8
23. Net Financial Result
The interest coverage ratio, defined as adjusted EBITDA divided by net interest
expense (interests and similar charges less income from financial fixed assets
and income from current assets), was 4.7 in 2004, compared to 4.4 in 2003. The
2004 net financial result includes :
• EUR 35.5 million other financial expenses representing bank fees, credit card fees
and losses incurred on foreign currency transactions (EUR 41.0 million in 2003)
• A credit of EUR 4.3 million related to the release of a valuation allowance
recorded on the treasury shares ow ned by Delhaize Group at December 31,
2004 (EUR 7.3 million in 2003)
• EUR 2.6 million related to the exercise of stock options by U.S. associates
(EUR 0.8 million in 2003)
• A EUR 3.6 million loss realized on the repurchase and early redemption by
Delhaize America of USD 52.4 million notes, debt securities, mortgage paya-
bles and other debt
• EUR 4.5 million interest income related to a tax refund at Delhaize America
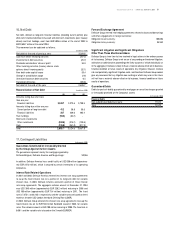
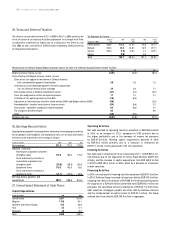
24. Net Exceptional Result
Net exceptional result during 2004 w as EUR -122.7 million, compared to
-EUR 144.9 million during 2003. In 2004, the net exceptional result consisted
primarily of :
• EUR 106.5 million for the Kash n’ Karry restructuring, including the closing of 34
stores and the rebranding of the remaining stores over the coming three years
to the new banner name “ Sweetbay Supermarket”
• EUR 9.2 million for the product losses, preparation and other costs incurred in
connection of four hurricanes and one tropical storm w hich hit Delhaize Group’s
operating banners in the Southeastern United States in September 2004, partly
offset by a credit of EUR 3.2 million representing an insurance reimbursement
related to Hurricane Isabel which impacted Food Lion in 2003
• EUR 2.8 million for the divestiture of Delhaize Group’s Thai operations
• Impairment charges of EUR 4.6 million, partly offset by the reversal of previous
impairment charges of EUR 2.2 million, on certain tangible fixed assets of Delvita
In 2003, the net exceptional expenses consisted primarily of :
• EUR 84.7 million to adjust inventory for the change from the Retail Inventory
Accounting M ethod to the Average Item Cost Inventory Accounting M ethod at
Food Lion and Kash n’ Karry
• EUR 30.7 million for the Food Lion restructuring, including the closing of 41 Food
Lion stores and one Kash n’ Karry store and the streamlining of the support
structure of Food Lion
• EUR 15.0 million for perishable product losses and other expenses due to
Hurricane Isabel
• A capital gain of EUR 9.8 million related to the sale of Delhaize Group’s 49%
interest in Singaporean food retailer Shop N Save
• Impairment charges on certain Kash n’ Karry, Delhaize Belgium and Delvita
tangible fixed assets (EUR 10.4 million), on the investment in the business-
to-business platform WWRE (7.1 million), on M ega Image goodw ill (EUR 5.5
million), on Food Lion Thailand goodwill and other intangible assets (EUR 3.2
million), partly offset by the reversal of previous impairment charges on certain
of Delvita’s tangible fixed assets (EUR 4.9 million)