Food Lion 2004 Annual Report Download - page 3
Download and view the complete annual report
Please find page 3 of the 2004 Food Lion annual report below. You can navigate through the pages in the report by either clicking on the pages listed below, or by using the keyword search tool below to find specific information within the annual report.-
 1
1 -
 2
2 -
 3
3 -
 4
4 -
 5
5 -
 6
6 -
 7
7 -
 8
8 -
 9
9 -
 10
10 -
 11
11 -
 12
12 -
 13
13 -
 14
14 -
15
-
16
-
17
-
18
-
19
-
20
-
21
-
22
-
23
-
24
-
25
-
26
-
27
-
28
-
29
-
30
-
31
-
32
-
33
-
34
-
35
-
36
-
37
-
38
-
39
-
40
-
41
-
42
-
43
-
44
-
45
-
46
-
47
-
48
-
49
-
50
-
51
-
52
-
53
-
54
-
55
-
56
-
57
-
58
-
59
-
60
-
61
-
62
-
63
-
64
-
65
-
66
-
67
-
68
-
69
-
70
-
71
-
72
-
73
-
74
-
75
-
76
-
77
-
78
-
79
-
80
-
81
-
82
-
83
-
84
-
85
-
86
-
87
-
88
 |
 |
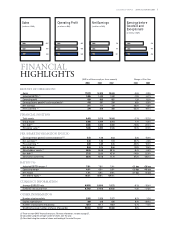
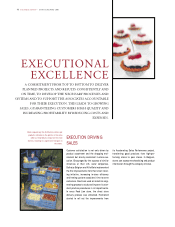
DELHAIZE GROUP ANNUAL REPORT 2004 1
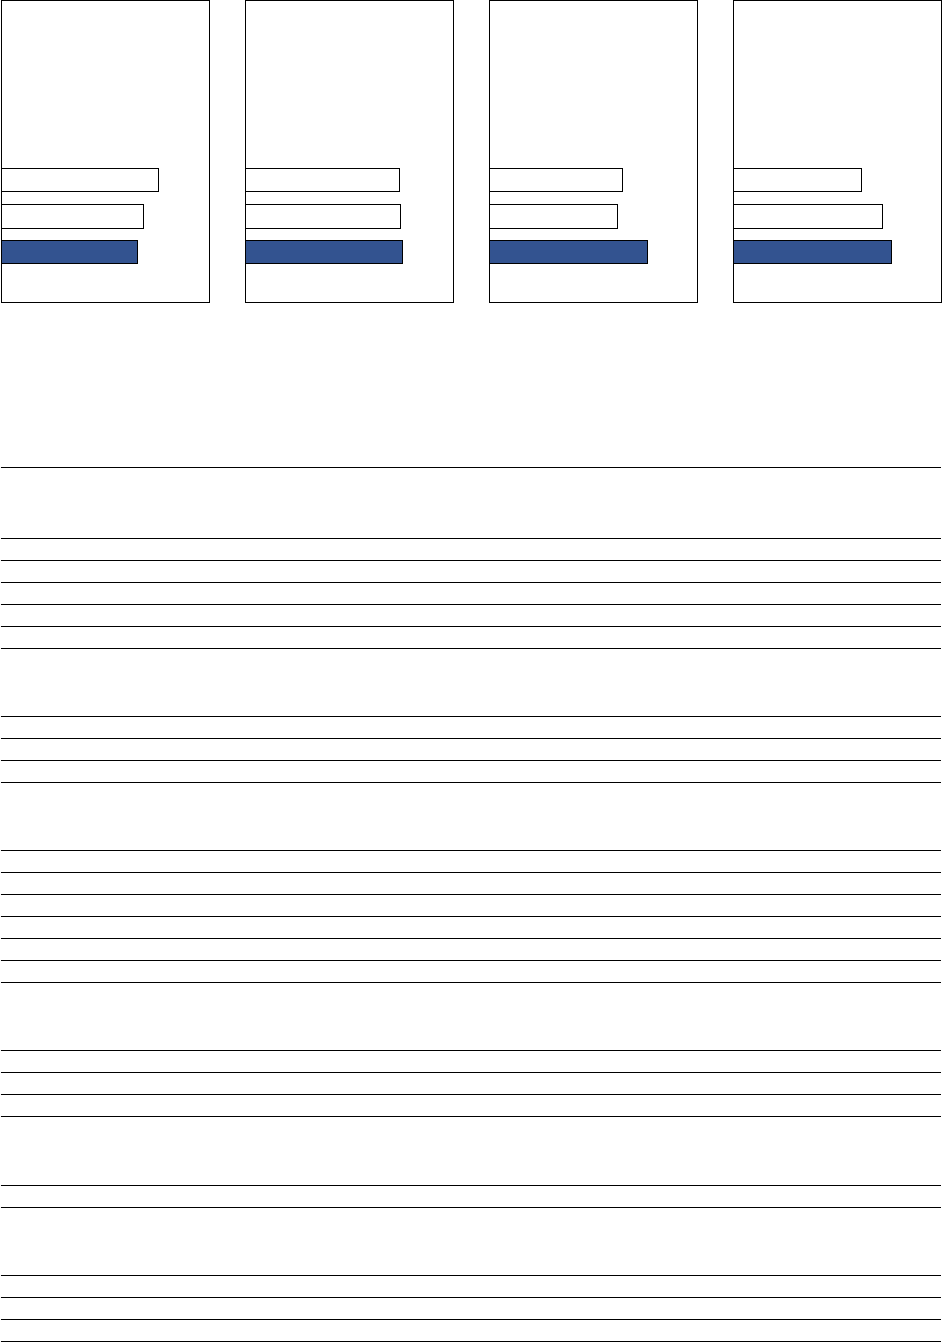
Earnings before
Goodw ill and
Exceptionals
(in millions of EUR)
Net Earnings
(in millions of EUR)
Operating Profi t
(in millions of EUR)
Sales
(in billions of EUR)
2004 2003 2002 2004 2003
RESULTS OF OPERATIONS
Sales 17,972 18,820 20,688 -4.5% -9.0%
Adjusted EBITDA
(1)
1,406 1,433 1,532 -1.9% -6.7%
Operating profit 820 809 807 1.3% 0.3%
Earnings before goodw ill and exceptionals
(1)
410 387 334 6.0% 15.6%
Net earnings 211 171 178 23.5% -4.0%
Free cash flow
(1)
278 358 300 -22.2% 19.1%
FINANCIAL POSITION
Total assets 9,403 9,519 10,840 -1.1% -12.2%
Group equity 3,406 3,369 3,563 1.1% -5.4%
Net debt
(1)
2,606 3,025 3,898 -13.8% -22.4%
Enterprise value
(3)
7,846 6,802 5,535 15.3% 22.9%
PER SHARE INFORMATION IN EUR
Earnings before goodw ill and exceptionals
(1)(2)
4.42 4.20 3.63 5.3% 15.6%
Net earnings
(2)
2.28 1.86 1.94 22.7% -4.0%
Free cash flow
(2)
3.00 3.89 3.26 -22.9% 19.3%
Net dividend 0.84 0.75 0.66 12.0% 13.6%
Shareholders’ equity
(3)
35.85 35.99 38.19 -0.4% -5.8%
Net debt
(3)
27.82 32.65 42.19 -14.8% -22.6%
Share price (year-end) 55.95 40.78 17.72 37.2% 130.1%
RATIOS %
Adjusted EBITDA
margin
(1)
7.8% 7.6% 7.4% +21 bps +20 bps
Operating margin 4.6% 4.3% 3.9% +26 bps +40 bps
Net margin 1.2% 0.9% 0.9% +27 bps +5 bps
Net debt to equity
(1)
76.5% 89.8% 109.4% - -
CURRENCY INFORMATION
Average EUR/USD rate 0.8039 0.8840 1.0575 -9.1% -16.4%
EUR/USD rate at year-end 0.7342 0.7918 0.9536 -7.3% -17.0%
OTHER INFORMATION
Number of sales outlets 2,565 2,559 2,527 0.2% 1.3%
Capital expenditures 490 448 635 9.3% -29.4%
Number of associates (thousands) 137.9 141.7 143.9 -2.7% -1.5%
Weighted average number of shares (thousands) 92,663 92,097 92,068 0.6% -
Change vs Prior Year
(1) These are non-GAAP fi nancial measures. For more information, see box on page 27.
(2) Calculated using the average number of shares over the year .
(3) Calculated using the number of shares outstanding at the end of the year.
(EUR in millions except per share amounts)
FINANCIAL
HIGHLIGHTS
20.7
18.8
18.0
2002
2003
2004
807
809
820
2002
2003
2004
178
171
211
2002
2003
2004
334
387
410
2002
2003
2004