Food Lion 2004 Annual Report Download - page 63
Download and view the complete annual report
Please find page 63 of the 2004 Food Lion annual report below. You can navigate through the pages in the report by either clicking on the pages listed below, or by using the keyword search tool below to find specific information within the annual report.-
 1
1 -
2
-
3
-
4
-
5
-
6
-
7
-
8
-
9
-
10
-
11
-
12
-
13
-
14
-
15
-
16
-
17
-
18
-
19
-
20
-
21
-
22
-
23
-
24
-
25
-
26
-
27
-
28
-
29
-
30
-
31
-
32
-
33
-
34
-
35
-
36
-
37
-
38
-
39
-
40
-
41
-
42
-
43
-
44
-
45
-
46
-
47
-
48
-
49
-
50
-
51
-
52
-
 53
53 -
 54
54 -
 55
55 -
 56
56 -
 57
57 -
 58
58 -
 59
59 -
 60
60 -
 61
61 -
 62
62 -
 63
63 -
 64
64 -
 65
65 -
 66
66 -
 67
67 -
 68
68 -
 69
69 -
 70
70 -
 71
71 -
 72
72 -
 73
73 -
74
-
75
-
76
-
77
-
78
-
79
-
80
-
81
-
82
-
83
-
84
-
85
-
86
-
87
-
88
 |
 |

DELHAIZE GROUP ANNUAL REPORT 2004 61
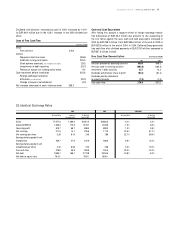
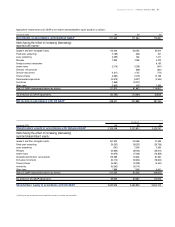
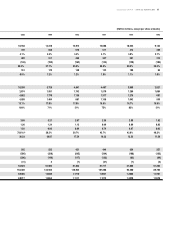
December 31,
(in thousands of EUR) 2004 2003 2002
Shareholders’ equity in accordance w ith Belgian GAAP
3,358,348
3,333,833
3,528,741
Items having the effect of increasing (decreasing)
reported shareholders’ equity:
Goodwill and Other Intangible Assets 267,922 124,968 21,698
Fixed asset accounting (39,252) (28,397) (29,758)
Lease accounting (291) 2,958 2,596
Pensions (32,032) (38,434) (50,014)
Income taxes (19,673) (17,349) (16,828)
Dividends and directors’ remuneration 105,289 92,846 81,306
Derivative instruments (44,774) (53,810) (78,054)
Treasury shares (16,361) (12,938) (5,942)
Inventories (16,592) (15,174) -
Other items 7,088 7,946 6,941
Total US GAAP adjustments before tax effects 211,324 62,508 (68,055)
Tax effects of US GAAP adjustments 33,263 63,480 94,056
Shareholders’ equity in accordance w ith US GAAP
3,602,935 3,459,929 3,554,742
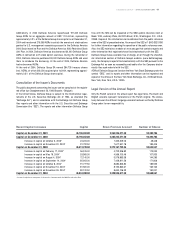
Approximate reconciliation to US GAAP of net income and shareholders' equity w ould be as follows* :
(in thousands of EUR) 2004 2003 2002
Net income in accordance w ith Belgian GAAP
211,453
171,260
178,307
Items having the effect of increasing (decreasing)
reported net income:
Goodwill and Other Intangible Assets 152,546 103,564 95,019
Fixed asset accounting (7,189) (365) 521
Lease accounting (3,499) 362 1,617
Pensions 2,033 3,368 4,370
Foreign currency transactions - - 8,130
Income taxes (2,176) (1,296) (641)
Directors’ remuneration - (690) (601)
Derivate instruments (1,317) 4,742 (772)
Treasury shares (4,302) (7,272) 12,168
Stock-based compensation (10,310) (5,027) (2,946)
Inventories (1,860) (15,912) -
Other items (2,053) 418 1,596
Total US GAAP adjustments before tax effects 121,873 81,892 118,461
Tax effects of US GAAP adjustments (24,785) (10,264) (9,359)
Net income in accordance w ith US GAAP
308,541 242,888 287,409
(*) Certain prior year amounts have been reclassified to conform to the current year presentation.