Food Lion 2004 Annual Report Download - page 41
Download and view the complete annual report
Please find page 41 of the 2004 Food Lion annual report below. You can navigate through the pages in the report by either clicking on the pages listed below, or by using the keyword search tool below to find specific information within the annual report.-
 1
1 -
2
-
3
-
4
-
5
-
6
-
7
-
8
-
9
-
10
-
11
-
12
-
13
-
14
-
15
-
16
-
17
-
18
-
19
-
20
-
21
-
22
-
23
-
24
-
25
-
26
-
27
-
28
-
29
-
30
-
 31
31 -
 32
32 -
 33
33 -
 34
34 -
 35
35 -
 36
36 -
 37
37 -
 38
38 -
 39
39 -
 40
40 -
 41
41 -
 42
42 -
 43
43 -
 44
44 -
 45
45 -
 46
46 -
 47
47 -
 48
48 -
 49
49 -
 50
50 -
 51
51 -
52
-
53
-
54
-
55
-
56
-
57
-
58
-
59
-
60
-
61
-
62
-
63
-
64
-
65
-
66
-
67
-
68
-
69
-
70
-
71
-
72
-
73
-
74
-
75
-
76
-
77
-
78
-
79
-
80
-
81
-
82
-
83
-
84
-
85
-
86
-
87
-
88
 |
 |

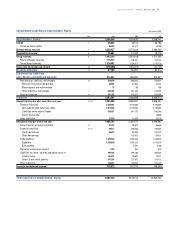
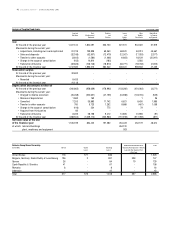
DELHAIZE GROUP ANNUAL REPORT 2004 39
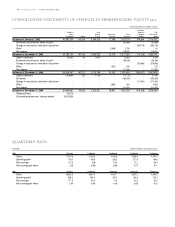
Consolidated Liabilities & Shareholders’ Equity
(in thousands of EUR)
Note 2004 2003 2002
Shareholders’ equity
3,358,348 3,333,833 3,528,741
Capital 7 46,834 46,312 46,196
Called up share capital 46,834 46,312 46,196
Share premium account 7 2,320,927 2,273,168 2,264,225
Revaluation reserves 8 18,661 14,762 15,119
Group reserves 9 1,442,234 1,352,618 1,277,325
Parent company reserves 115,372 128,547 140,146
Consolidated reserves 1,326,862 1,224,071 1,137,179
Cumulative translation adjustment 10 (470,308) (353,027)
(74,124)
M inority interests
11 47,750 35,291 34,314
Provisions for liabilities
and charges and deferred taxation
614,441
659,990
870,807
Provisions for liabilities and charges 12 272,676 280,915 324,874
Pensions and similar obligations 38,895 37,632 45,133
M ajor repairs and maintenance 75 88 188
Other liabilities and charges 233,706 243,195 279,553
Deferred taxation 13 341,765 379,075 545,933
Creditors
5,382,201 5,489,988 6,406,270
Amounts falling due after more than one year 14
, 16
3,365,596 3,288,500 3,806,631
Financial liabilities 3,343,667 3,272,630 3,790,502
Non-subordinated debenture loans 2,813,346 2,729,502 3,105,950
Liabilities under capital leases 530,321 543,128 666,549
Credit institutions - - 18,003
Other liabilities 21,929 15,870 16,129
Amounts falling due w ithin one year 1,886,792 2,054,474 2,449,980
Current portion of long-term debts 14 41,223 38,822 59,640
Financial liabilities 15
, 16
20,677 239,016 465,404
Credit institutions 20,677 85,995 337,273
Other borrow ings - 153,021 128,131
Trade creditors 1,336,650 1,330,559 1,458,323
Suppliers 1,336,650 1,326,322 1,454,573
Bills payable - 4,237 3,750
Payments received on account 1,755 964 879
Liabilities for taxes, salaries and social security 346,165 298,189 333,543
Income taxes 104,871 70,852 75,421
Salaries and social security 241,294 227,337 258,122
Other liabilities 140,322 146,924 132,191
Accruals and deferred income 129,813 147,014 149,659
Total liabilities & shareholders' equity
9,402,740 9,519,102 10,840,132