Food Lion 2004 Annual Report Download - page 32
Download and view the complete annual report
Please find page 32 of the 2004 Food Lion annual report below. You can navigate through the pages in the report by either clicking on the pages listed below, or by using the keyword search tool below to find specific information within the annual report.-
 1
1 -
2
-
3
-
4
-
5
-
6
-
7
-
8
-
9
-
10
-
11
-
12
-
13
-
14
-
15
-
16
-
17
-
18
-
19
-
20
-
21
-
 22
22 -
 23
23 -
 24
24 -
 25
25 -
 26
26 -
 27
27 -
 28
28 -
 29
29 -
 30
30 -
 31
31 -
 32
32 -
 33
33 -
 34
34 -
 35
35 -
 36
36 -
 37
37 -
 38
38 -
 39
39 -
 40
40 -
 41
41 -
 42
42 -
43
-
44
-
45
-
46
-
47
-
48
-
49
-
50
-
51
-
52
-
53
-
54
-
55
-
56
-
57
-
58
-
59
-
60
-
61
-
62
-
63
-
64
-
65
-
66
-
67
-
68
-
69
-
70
-
71
-
72
-
73
-
74
-
75
-
76
-
77
-
78
-
79
-
80
-
81
-
82
-
83
-
84
-
85
-
86
-
87
-
88
 |
 |
DELHAIZE GROUP ANNUAL REPORT 2004
30
fully remodeled and 14 company-operated supermarkets have undergone a
minor remodeling. Capital spending in information technologies, logistics and
distribution, and miscellaneous categories amounted to EUR 217.4 million,
compared to EUR 136.6 million in 2003.
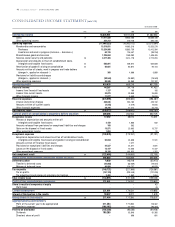
In 2004, net cash used in fi nancing activities amounted to EUR 41.6
million, compared to EUR 341.1 million in 2003. In 2004, Delhaize Group
increased its long-term debt by EUR 220.5 million, including new debt in the
amount of EUR 299.5 million representing mainly the issuance of a EUR 300
million convertible bond (EUR 295.2 million net proceeds), the retirement of
EUR 42.1 million in principal of Delhaize America debt and the reimbursement
of capital leases for EUR 30.7 million. In 2004, short-term debt w as reduced
by EUR 205.9 million.
Dividends and directors’ remuneration paid in 2004 amounted to EUR 94.9
million, a 14.4% increase compared to the previous year due to the higher
2003 dividend per share.
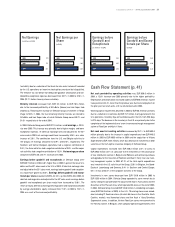
In 2004, Delhaize Group generated free cash fl ow after dividend payments
of EUR 278.0 million (1.5% of sales). Cash and cash equivalents increased
signifi cantly from EUR 393.6 million at the end of 2003 to EUR 662.8 million
at the end of 2004, despite a negative effect of foreign exchange translation
differences of EUR 32.5 million primarily due to the w eakening of the U.S.
dollar against the euro.
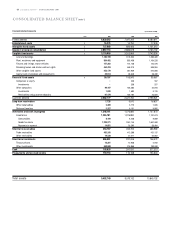
Balance Sheet (p. 38)
In 2004, total assets of Delhaize Group declined 1.2% to EUR 9.4 billion.
Exchange rate changes, primarily of the U.S. dollar, were the main reason for
the decrease. From December 31, 2003 to December 31, 2004, the U.S. dollar
weakened by 7.3% against the euro.
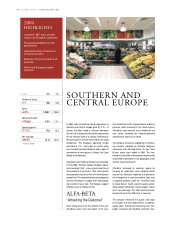
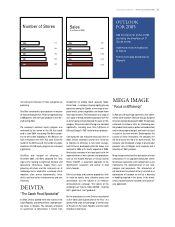
At the end of 2004, Delhaize Group’s sales netw ork consisted of 2,565 stores,
a net increase of six stores. Of these 2,565 stores, 317 w ere ow ned by the
company (116 in the U.S., 126 in Belgium and 75 in Southern and Central
Europe), 573 w ere held under capital leases and 1,318 under operating leases.
The remaining 357 stores were affi liated stores owned by their operators or
directly leased by their operators from a third party. Delhaize Group ow ned 11
of its 12 w arehousing and distribution facilities in the U.S., fi ve distribution
centers in Belgium, two distribution centers in Greece and tw o in the Czech
Republic.
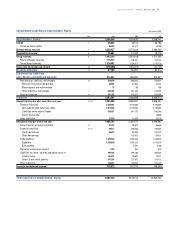
In 2004, group equity, including minority interests, increased by 1.1% to
EUR 3.4 billion. The increase of EUR 37.0 million w as net of a decrease of
EUR 117.3 million due to translation differences as a result of the weakening
of the U.S. dollar, an increase of EUR 106.2 million due to the appropriation
of profi t and an increase of EUR 31.2 million due to the exercise of warrants
by U.S. associates.
In 2004, the number of outstanding Delhaize Group shares, including treasury
shares, increased by 1,044,004 shares to 93,668,561 due to the exercise of
warrants. The Group repurchased 191,403 of its shares and used 215,558 trea-
sury shares in 2004 in connection with its stock option programs. At the end of
2004, Delhaize Group owned 294,735 treasury shares, valued at EUR 55.95 per
share, compared to an average purchase price of EUR 62.2 per share.
At the end of 2004, Delhaize Group’s provisions for liabilities and charges
totaled EUR 272.7 million. These provisions relate primarily to store closing
reserves in the U.S. (EUR 109.4 million), self-insurance reserves related to
workers’ compensation, general liability, vehicle accident and druggist claims
(EUR 100.5 million) and pension liabilities at Hannaford, Delhaize Belgium and
Alfa-Beta (EUR 38.9 million).
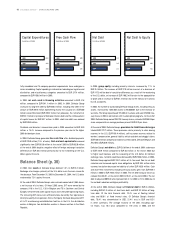
Delhaize Group’s net debt w as EUR 2.6 billion at the end of 2004, a decrease
of EUR 418.9 million compared to EUR 3.0 billion at the end of 2003 due
to higher cash balances and the w eakening of the U.S. dollar. At identical
exchange rates, net debt would have decreased by EUR 250.8 million. In 2004,
Delhaize Group applied EUR 310.1 million of its free cash fl ow to net debt
reduction and increased capital lease obligations by EUR 59.4 million while
currency translation decreased net debt by a further EUR 165.8 million. Cash
and short-term investments excluding treasury shares grew from EUR 459.1
million in 2003 to EUR 746.4 million in 2004. The net debt to equity ratio was
reduced from 89.8% at the end of 2003 to 76.5% at the end of 2004. The net
debt to adjusted EBITDA ratio improved from 2.1 in 2003 to 1.9 in 2004 due to
the net debt reduction and higher profi tability.
At the end of 2004, Delhaize Group had fi nancial debt of EUR 3.4 billion,
including EUR 61.9 million of short-term debt and EUR 3.3 billion of long-
term debt. Of the total fi nancial debt, 13.4% was at fl oating interest
rates and 86.6% at fi xed interest rates. Of Delhaize Group’s fi nancial
debt, 78.4% was denominated in USD, 21.4% was in EUR and 0.2%
in other currencies. The average maturity of the debt, excluding capi-
tal leases, w as 10.4 years compared to 11.9 years in 2003, and the
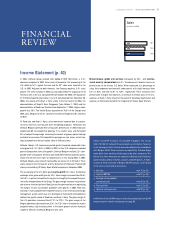
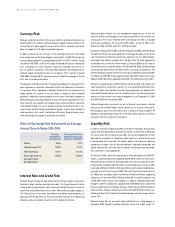
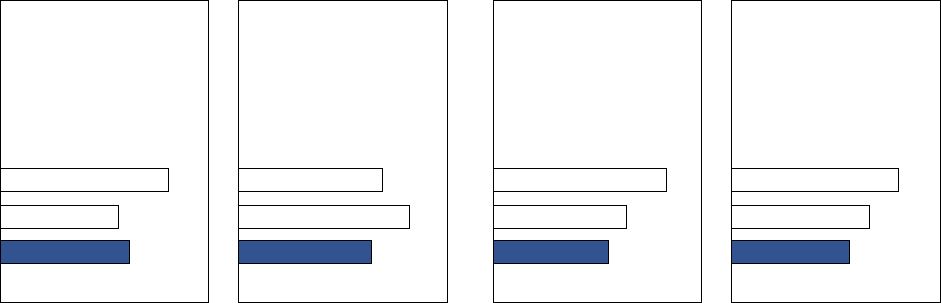
Capital Expenditures
(in millions of EUR)
635
448
490
2002
2003
2004
Free Cash Flow
(in millions of EUR)
300
357
278
2002
2003
2004
Net Debt
(in billions of EUR)
3.9
3.0
2.6
2002
2003
2004
Net Debt to Equity
109%
90%
76%
2002
2003
2004