3M 2011 Annual Report Download - page 6
Download and view the complete annual report
Please find page 6 of the 2011 3M annual report below. You can navigate through the pages in the report by either clicking on the pages listed below, or by using the keyword search tool below to find specific information within the annual report.-
 1
1 -
 2
2 -
 3
3 -
 4
4 -
 5
5 -
 6
6 -
 7
7 -
 8
8 -
 9
9 -
 10
10 -
 11
11 -
 12
12 -
 13
13 -
 14
14 -
 15
15 -
 16
16 -
 17
17 -
18
-
19
-
20
-
21
-
22
-
23
-
24
-
25
-
26
-
27
-
28
-
29
-
30
-
31
-
32
-
33
-
34
-
35
-
36
-
37
-
38
-
39
-
40
-
41
-
42
-
43
-
44
-
45
-
46
-
47
-
48
-
49
-
50
-
51
-
52
-
53
-
54
-
55
-
56
-
57
-
58
-
59
-
60
-
61
-
62
-
63
-
64
-
65
-
66
-
67
-
68
-
69
-
70
-
71
-
72
-
73
-
74
-
75
-
76
-
77
-
78
-
79
-
80
-
81
-
82
-
83
-
84
-
85
-
86
-
87
-
88
-
89
-
90
-
91
-
92
-
93
-
94
-
95
-
96
-
97
-
98
-
99
-
100
-
101
-
102
-
103
-
104
-
105
-
106
-
107
-
108
-
109
-
110
-
111
-
112
-
113
-
114
-
115
-
116
-
117
-
118
-
119
-
120
-
121
-
122
-
123
-
124
-
125
-
126
-
127
-
128
-
129
-
130
-
131
-
132
 |
 |

4 Inspired Innovation
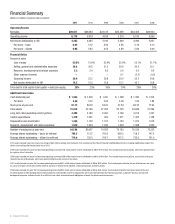
Financial Summary
(Dollars in millions, except per share amounts)
2011 2010 2009 2008 2007 2006
Operating Results
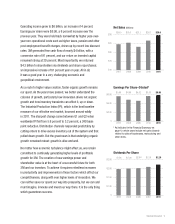
Net sales $29,611 $26,662 $23,123 $25,269 $24,462 $22,923
Operating income 6,178 5,918 4,814 5,218 6,193 5,696
Net income attributable to 3M 4,283 4,085 3,193 3,460 4,096 3,851
Per share – basic 6.05 5.72 4.56 4.95 5.70 5.15
Per share – diluted 5.96 5.63 4.52 4.89 5.60 5.06
Financial Ratios
Percent of sales
Cost of sales 53.0% 51.9% 52.4% 52.9% 52.1% 51.1%
Selling, general and administrative expenses 20.8 20.5 21.2 20.8 20.5 22.1
Research, development and related expenses 5.3 5.4 5.6 5.6 5.6 6.6
Other expense (income) – – – 0.1 (3.5) (4.6)
Operating income 20.9 22.2 20.8 20.6 25.3 24.8
Net income attributable to 3M 14.5 15.3 13.8 13.7 16.7 16.8
Total debt to total capital (total capital = debt plus equity) 25% 25% 30% 39% 29% 26%
Additional Information
Cash dividends paid $ 1,555 $ 1,500 $ 1,431 $ 1,398 $ 1,380 $ 1,376
Per share 2.20 2.10 2.04 2.00 1.92 1.84
Stock price at year-end 81.73 86.30 82.67 57.54 84.32 77.93
Total assets 31,616 30,156 27,250 25,793 24,699 21,294
Long-term debt (excluding current portion) 4,484 4,183 5,097 5,166 4,019 1,047
Capital expenditures 1,379 1,091 903 1,471 1,422 1,168
Depreciation and amortization 1,236 1,120 1,157 1,153 1,072 1,079
Research, development and related expenses 1,570 1,434 1,293 1,404 1,368 1,522
Number of employees at year-end 84,198 80,057 74,835 79,183 76,239 75,333
Average shares outstanding – basic (in millions) 708.5 713.7 700.5 699.2 718.3 747.5
Average shares outstanding – diluted (in millions) 719.0 725.5 706.7 707.2 732.0 761.0
2010 results included a one-time income tax charge of $84 million resulting from the March 2010 enactment of the Patient Protection and Affordable Care Act, including modifications made in the
Health Care and Education Reconciliation Act of 2010.
2009 results included net losses that decreased operating income by $194 million and net income attributable to 3M by $119 million. This included restructuring actions, which were partially offset
by a gain on sale of real estate.
2008 results included net losses that decreased operating income by $269 million and net income attributable to 3M by $194 million. This included restructuring actions, exit activities and losses
related to the sale of businesses, which were partially offset by a gain on sale of real estate.
2007 results included net gains that increased operating income by $681 million and net income attributable to 3M by $448 million. This included gains related to the sale of businesses and a gain
on sale of real estate, which were partially offset by increases in environmental liabilities, restructuring actions and exit activities.
2006 results included net gains that increased operating income by $523 million and net income attributable to 3M by $438 million. This included net benefits from gains related to the sale
of certain portions of 3M’s branded pharmaceuticals business and favorable income tax adjustments, which were partially offset by restructuring actions, acquired in-process research and
development expenses, settlement costs of an antitrust class action, and environmental obligations related to the pharmaceuticals business.