3M 2011 Annual Report Download - page 22
Download and view the complete annual report
Please find page 22 of the 2011 3M annual report below. You can navigate through the pages in the report by either clicking on the pages listed below, or by using the keyword search tool below to find specific information within the annual report.-
 1
1 -
2
-
3
-
4
-
5
-
6
-
7
-
8
-
9
-
10
-
11
-
 12
12 -
 13
13 -
 14
14 -
 15
15 -
 16
16 -
 17
17 -
 18
18 -
 19
19 -
 20
20 -
 21
21 -
 22
22 -
 23
23 -
 24
24 -
 25
25 -
 26
26 -
 27
27 -
 28
28 -
 29
29 -
 30
30 -
 31
31 -
 32
32 -
33
-
34
-
35
-
36
-
37
-
38
-
39
-
40
-
41
-
42
-
43
-
44
-
45
-
46
-
47
-
48
-
49
-
50
-
51
-
52
-
53
-
54
-
55
-
56
-
57
-
58
-
59
-
60
-
61
-
62
-
63
-
64
-
65
-
66
-
67
-
68
-
69
-
70
-
71
-
72
-
73
-
74
-
75
-
76
-
77
-
78
-
79
-
80
-
81
-
82
-
83
-
84
-
85
-
86
-
87
-
88
-
89
-
90
-
91
-
92
-
93
-
94
-
95
-
96
-
97
-
98
-
99
-
100
-
101
-
102
-
103
-
104
-
105
-
106
-
107
-
108
-
109
-
110
-
111
-
112
-
113
-
114
-
115
-
116
-
117
-
118
-
119
-
120
-
121
-
122
-
123
-
124
-
125
-
126
-
127
-
128
-
129
-
130
-
131
-
132
 |
 |

16
2011 2010
2011 vs. 2010
% change
(Dollars in millions)
Net
Sales
% of
Total
Oper.
Income
Net
Sales
% of
Total
Oper.
Income
Net
Sales
Oper.
Income
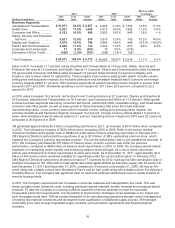
Business Segments
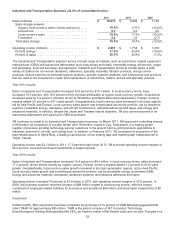
Industrial and Transportation . $ 10,073 34.0 % $ 2,057 $ 8,429 31.6 % $ 1,754 19.5 % 17.3 %
Health Care ............................ 5,031 17.0 % 1,489
4,513 16.9 % 1,362 11.5 % 9.3 %
Consumer and Office ............. 4,153 14.0 % 840
3,853 14.5 % 840 7.8 % — %
Safety, Security and Protection
Services .............................. 3,821 12.9 % 814
3,316 12.4 % 709 15.2 % 14.9 %
Display and Graphics ............. 3,674 12.4 % 788
3,884 14.6 % 946 (5.4 )% (16.6 )%
Electro and Communications . 3,306 11.2 % 712
3,043 11.4 % 670 8.6 % 6.2 %
Corporate and Unallocated .... 11 0.0 % (421 ) 10 0.0 % (278)
Elimination of Dual Credit ....... (458) (1.5 )% (101 ) (386) (1.4 )% (85)
Total Company ....................... $ 29,611 100.0 % $ 6,178 $ 26,662 100.0 % $ 5,918 11.1 % 4.4 %
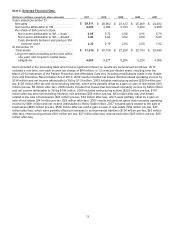
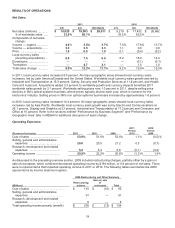
Sales in 2011 increased 11.1 percent, led by Industrial and Transportation at 19.5 percent, Safety, Security and
Protection Services at 15.2 percent, and Health Care at 11.5 percent. Electro and Communications sales increased
8.6 percent and Consumer and Office sales increased 7.8 percent. Sales declined 5.4 percent in Display and
Graphics, due to fewer orders for optical films. Total company local-currency sales growth (which includes volume,
selling price and acquisition impacts, but excludes divestiture and translation impacts) was 8.0 percent and foreign
currency impacts added 3.1 percent. 3M’s business segments all posted operating income margins in excess of 20
percent in 2011 and 2010. Worldwide operating income margins for 2011 were 20.9 percent, compared to 22.2
percent for 2010.
In 2010, sales increased 15.3 percent, led by Electro and Communications at 27.5 percent, Display and Graphics at
24.0 percent, Industrial and Transportation at 18.4 percent, and Consumer and Office at 11.0 percent. Sales growth
in these business segments was led by consumer electronics, automotive OEM, renewable energy, and broad-based
consumer and office growth, as well as sales growth in those businesses that serve the broad industrial
manufacturing sector. Local-currency sales (which includes volume, selling price and acquisition impacts, but
excludes divestiture and translation impacts) increased 14.4 percent. Foreign currency effects added 1.0 percent to
sales, while divestiture impacts reduced sales by 0.1 percent. Operating income margins for 2010 were 22.2 percent,
compared to 20.8 percent in 2009.
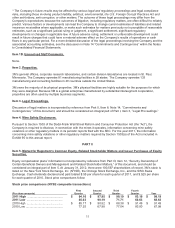
3M generated approximately $5.3 billion of operating cash flows in 2011, an increase of $110 million when compared
to 2010. This followed an increase of $233 million when comparing 2010 to 2009. Refer to the section entitled
“Financial Condition and Liquidity” later in MD&A for a discussion of items impacting cash flows. In February 2011,
3M’s Board of Directors authorized the repurchase of up to $7.0 billion of 3M’s outstanding common stock, which
replaced the Company’s previous repurchase program. The current authorization has no pre-established end date. In
2011, the Company purchased $2.701 billion of treasury stock, of which a portion was under the previous
authorization, compared to $854 million of treasury stock repurchases in 2010. In 2009, the Company placed added
emphasis on maintaining ample liquidity and enhancing balance sheet strength. As a result, share repurchase
activity was minimal and no broker repurchases of stock were made. As of December 31, 2011, approximately $4.6
billion of 3M common stock remained available for repurchase under the current authorization. In February 2012,
3M’s Board of Directors authorized a dividend increase of 7.3 percent for 2012, marking the 54th consecutive year of
dividend increases for 3M. 3M’s debt to total capital ratio (total capital defined as debt plus equity) was 25 percent at
both December 31, 2011 and December 31, 2010, compared to 30 percent at December 31, 2009. 3M has an AA-
credit rating with a stable outlook from Standard & Poor’s and an Aa2 credit rating with a stable outlook from Moody’s
Investors Service. The Company has significant cash on hand and sufficient additional access to capital markets to
meet its funding needs.
In 2011, the Company experienced cost increases in most raw materials and transportation fuel costs. This was
driven by higher basic feedstock costs, including petroleum based materials, metals, minerals and woodpulp-based
products. To date the Company is receiving sufficient quantities of all raw materials to meet its reasonably
foreseeable production requirements. It is impossible to predict future shortages of raw materials or the impact any
such shortages would have. 3M has avoided disruption to its manufacturing operations through careful management
of existing raw material inventories and development and qualification of additional supply sources. 3M manages
commodity price risks through negotiated supply contracts, price protection agreements and forward physical
contracts.
2011 2010
2011 vs. 2010
% change
(Dollars in millions)
Net
Sales
% of
Total
Oper.
Income
Net
Sales
% of
Total
Oper.
Income
Net
Sales
Oper.
Income
Business Segments
Industrial and Transportation . $ 10,073 34.0 % $ 2,057 $ 8,429 31.6 % $ 1,754 19.5 % 17.3 %
Health Care ............................ 5,031 17.0 % 1,489
4,513 16.9 % 1,362 11.5 % 9.3 %
Consumer and Office ............. 4,153 14.0 % 840
3,853 14.5 % 840 7.8 % — %
Safety, Security and Protection
Services .............................. 3,821 12.9 % 814
3,316 12.4 % 709 15.2 % 14.9 %
Display and Graphics ............. 3,674 12.4 % 788
3,884 14.6 % 946 (5.4 )% (16.6 )%
Electro and Communications . 3,306 11.2 % 712
3,043 11.4 % 670 8.6 % 6.2 %
Corporate and Unallocated .... 11 0.0 % (421 ) 10 0.0 % (278 )
Elimination of Dual Credit ....... (458) (1.5 )% (101 ) (386) (1.4 )% (85 )
Total Company ....................... $ 29,611 100.0 % $ 6,178 $ 26,662 100.0 % $ 5,918 11.1 % 4.4 %
Sales in 2011 increased 11.1 percent, led by Industrial and Transportation at 19.5 percent, Safety, Security and
Protection Services at 15.2 percent, and Health Care at 11.5 percent. Electro and Communications sales increased
8.6 percent and Consumer and Office sales increased 7.8 percent. Sales declined 5.4 percent in Display and
Graphics, due to fewer orders for optical films. Total company local-currency sales growth (which includes volume,
selling price and acquisition impacts, but excludes divestiture and translation impacts) was 8.0 percent and foreign
currency impacts added 3.1 percent. 3M’s business segments all posted operating income margins in excess of 20
percent in 2011 and 2010. Worldwide operating income margins for 2011 were 20.9 percent, compared to 22.2
percent for 2010.
In 2010, sales increased 15.3 percent, led by Electro and Communications at 27.5 percent, Display and Graphics at
24.0 percent, Industrial and Transportation at 18.4 percent, and Consumer and Office at 11.0 percent. Sales growth
in these business segments was led by consumer electronics, automotive OEM, renewable energy, and broad-based
consumer and office growth, as well as sales growth in those businesses that serve the broad industrial
manufacturing sector. Local-currency sales (which includes volume, selling price and acquisition impacts, but
excludes divestiture and translation impacts) increased 14.4 percent. Foreign currency effects added 1.0 percent to
sales, while divestiture impacts reduced sales by 0.1 percent. Operating income margins for 2010 were 22.2 percent,
compared to 20.8 percent in 2009.
3M generated approximately $5.3 billion of operating cash flows in 2011, an increase of $110 million when compared
to 2010. This followed an increase of $233 million when comparing 2010 to 2009. Refer to the section entitled
“Financial Condition and Liquidity” later in MD&A for a discussion of items impacting cash flows. In February 2011,
3M’s Board of Directors authorized the repurchase of up to $7.0 billion of 3M’s outstanding common stock, which
replaced the Company’s previous repurchase program. The current authorization has no pre-established end date. In
2011, the Company purchased $2.701 billion of treasury stock, of which a portion was under the previous
authorization, compared to $854 million of treasury stock repurchases in 2010. In 2009, the Company placed added
emphasis on maintaining ample liquidity and enhancing balance sheet strength. As a result, share repurchase
activity was minimal and no broker repurchases of stock were made. As of December 31, 2011, approximately $4.6
billion of 3M common stock remained available for repurchase under the current authorization. In February 2012,
3M’s Board of Directors authorized a dividend increase of 7.3 percent for 2012, marking the 54th consecutive year of
dividend increases for 3M. 3M’s debt to total capital ratio (total capital defined as debt plus equity) was 25 percent at
both December 31, 2011 and December 31, 2010, compared to 30 percent at December 31, 2009. 3M has an AA-
credit rating with a stable outlook from Standard & Poor’s and an Aa2 credit rating with a stable outlook from Moody’s
Investors Service. The Company has significant cash on hand and sufficient additional access to capital markets to
meet its funding needs.
In 2011, the Company experienced cost increases in most raw materials and transportation fuel costs. This was
driven by higher basic feedstock costs, including petroleum-based materials, metals, minerals and woodpulp-based
products. To date the Company is receiving sufficient quantities of all raw materials to meet its reasonably
foreseeable production requirements. It is impossible to predict future shortages of raw materials or the impact any
such shortages would have. 3M has avoided disruption to its manufacturing operations through careful management
of existing raw material inventories and development and qualification of additional supply sources. 3M manages
commodity price risks through negotiated supply contracts, price protection agreements and forward physical
contracts.