3M 2011 Annual Report Download - page 122
Download and view the complete annual report
Please find page 122 of the 2011 3M annual report below. You can navigate through the pages in the report by either clicking on the pages listed below, or by using the keyword search tool below to find specific information within the annual report.-
 1
1 -
2
-
3
-
4
-
5
-
6
-
7
-
8
-
9
-
10
-
11
-
12
-
13
-
14
-
15
-
16
-
17
-
18
-
19
-
20
-
21
-
22
-
23
-
24
-
25
-
26
-
27
-
28
-
29
-
30
-
31
-
32
-
33
-
34
-
35
-
36
-
37
-
38
-
39
-
40
-
41
-
42
-
43
-
44
-
45
-
46
-
47
-
48
-
49
-
50
-
51
-
52
-
53
-
54
-
55
-
56
-
57
-
58
-
59
-
60
-
61
-
62
-
63
-
64
-
65
-
66
-
67
-
68
-
69
-
70
-
71
-
72
-
73
-
74
-
75
-
76
-
77
-
78
-
79
-
80
-
81
-
82
-
83
-
84
-
85
-
86
-
87
-
88
-
89
-
90
-
91
-
92
-
93
-
94
-
95
-
96
-
97
-
98
-
99
-
100
-
101
-
102
-
103
-
104
-
105
-
106
-
107
-
108
-
109
-
110
-
111
-
 112
112 -
 113
113 -
 114
114 -
 115
115 -
 116
116 -
 117
117 -
 118
118 -
 119
119 -
 120
120 -
 121
121 -
 122
122 -
 123
123 -
 124
124 -
 125
125 -
 126
126 -
 127
127 -
 128
128 -
 129
129 -
 130
130 -
 131
131 -
 132
132
 |
 |

116
marketable securities; insurance receivables; deferred income taxes; certain investments and other assets, including
prepaid pension assets. Corporate and unallocated assets can change from year to year due to changes in cash,
cash equivalents and marketable securities, changes in prepaid pension benefits, and changes in other unallocated
asset categories.
The most significant items impacting 2009 results were restructuring actions. Refer to Note 4 for discussion of
restructuring actions.
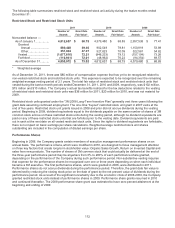
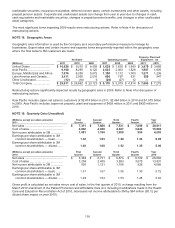
NOTE 18. Geographic Areas
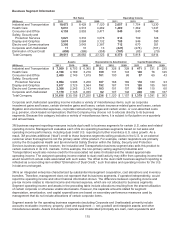
Geographic area information is used by the Company as a secondary performance measure to manage its
businesses. Export sales and certain income and expense items are generally reported within the geographic area
where the final sales to 3M customers are made.
Net Sales Operating Income
Property, Plant and
Equipment - net
(Millions) 2011 2010 2009 2011 2010 2009 2011 2010
United States ......................... $ 10,028
$ 9,210 $ 8,509 $ 1,629
$ 1,636 $ 1,640
$ 3,979
$ 3,888
A
sia Pacific ............................ 9,108
8,259 6,120
2,523
2,400 1,528 1,887 1,605
Europe, Middle East and Africa
7,076
6,259 5,972
1,150
1,112 1,003 1,271 1,239
Latin America and Canada .... 3,411
2,950 2,516
896
797 631 529 547
Other Unallocated ................. (12 ) (16 ) 6
(20 ) (27) 12
—
—
Total Company ...................... $ 29,611
$ 26,662 $ 23,123 $ 6,178
$ 5,918 $ 4,814
$ 7,666
$ 7,279
Restructuring actions significantly impacted results by geographic area in 2009. Refer to Note 4 for discussion of
restructuring actions.
Asia Pacific includes Japan net sales to customers of $2.674 billion in 2011, $2.464 billion in 2010 and $1.979 billion
in 2009. Asia Pacific includes Japan net property, plant and equipment of $428 million in 2011 and $420 million in
2010.
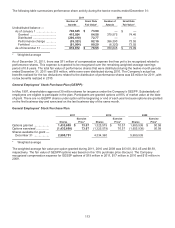
NOTE 19. Quarterly Data (Unaudited)
(Millions, except per-share amounts)
2011
First
Quarter
Second
Quarter
Third
Quarter
Fourth
Quarter
Year
2011
Net sales ............................................... $ 7,311 $ 7,680 $ 7,531 $ 7,089 $ 29,611
Cost of sales .......................................... 3,802 4,040 4,027 3,824 15,693
Net income attributable to 3M ............... 1,081 1,160 1,088 954 4,283
Earnings per share attributable to 3M
common shareholders — basic ......... 1.52 1.63 1.54 1.36 6.05
Earnings per share attributable to 3M
common shareholders — diluted ....... 1.49 1.60 1.52 1.35 5.96
(Millions, except per-share amounts)
2010
First
Quarter
Second
Quarter
Third
Quarter
Fourth
Quarter
Year
2010
Net sales ............................................... $ 6,348 $ 6,731 $ 6,874 $ 6,709 $ 26,662
Cost of sales .......................................... 3,238 3,435 3,583 3,575 13,831
Net income attributable to 3M ............... 930 1,121 1,106 928 4,085
Earnings per share attributable to 3M
common shareholders — basic ......... 1.31 1.57 1.55 1.30 5.72
Earnings per share attributable to 3M
common shareholders — diluted ....... 1.29 1.54 1.53 1.28 5.63
Gross profit is calculated as net sales minus cost of sales. In the first quarter of 2010, a charge resulting from the
March 2010 enactment of the Patient Protection and Affordable Care Act, including modifications made in the Health
Care and Education Reconciliation Act of 2010, decreased net income attributable to 3M by $84 million ($0.12 per
diluted share impact on year 2010).