3M 2011 Annual Report Download - page 25
Download and view the complete annual report
Please find page 25 of the 2011 3M annual report below. You can navigate through the pages in the report by either clicking on the pages listed below, or by using the keyword search tool below to find specific information within the annual report.-
 1
1 -
2
-
3
-
4
-
5
-
6
-
7
-
8
-
9
-
10
-
11
-
12
-
13
-
14
-
 15
15 -
 16
16 -
 17
17 -
 18
18 -
 19
19 -
 20
20 -
 21
21 -
 22
22 -
 23
23 -
 24
24 -
 25
25 -
 26
26 -
 27
27 -
 28
28 -
 29
29 -
 30
30 -
 31
31 -
 32
32 -
 33
33 -
 34
34 -
 35
35 -
36
-
37
-
38
-
39
-
40
-
41
-
42
-
43
-
44
-
45
-
46
-
47
-
48
-
49
-
50
-
51
-
52
-
53
-
54
-
55
-
56
-
57
-
58
-
59
-
60
-
61
-
62
-
63
-
64
-
65
-
66
-
67
-
68
-
69
-
70
-
71
-
72
-
73
-
74
-
75
-
76
-
77
-
78
-
79
-
80
-
81
-
82
-
83
-
84
-
85
-
86
-
87
-
88
-
89
-
90
-
91
-
92
-
93
-
94
-
95
-
96
-
97
-
98
-
99
-
100
-
101
-
102
-
103
-
104
-
105
-
106
-
107
-
108
-
109
-
110
-
111
-
112
-
113
-
114
-
115
-
116
-
117
-
118
-
119
-
120
-
121
-
122
-
123
-
124
-
125
-
126
-
127
-
128
-
129
-
130
-
131
-
132
 |
 |

19
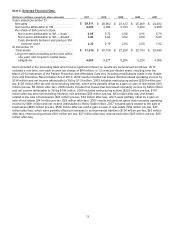
Pension and postretirement expense increased in both 2011 and 2010. The year-on-year increase for 2011
compared to 2010, and 2010 compared to 2009, was $233 million and $99 million, respectively. These increases
negatively impacted cost of sales; selling, general and administrative expenses (SG&A); and research, development
and related expenses (R&D).
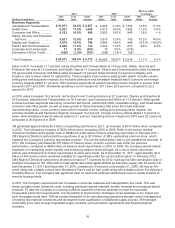
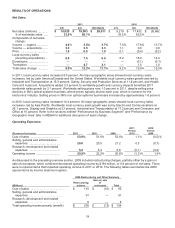
Cost of Sales:
Cost of sales includes manufacturing, engineering and freight costs. Cost of sales, measured as a percent of net
sales, was 53.0 percent in 2011, an increase of 1.1 percentage points from 2010 levels. On a dollar basis, selling
price increases largely offset raw material inflation for total year 2011, as selling prices increased 1 percent year-on-
year and gross raw material prices increased approximately 4 percent year-on-year. However, measured as a
percent of sales, selling price/gross raw material impacts accounted for approximately 0.5 percentage points of the
cost of sales increase. As discussed in the preceding paragraph, cost of sales as a percent of net sales was also
negatively impacted by higher pension and postretirement costs. These impacts were partially offset by organic sales
volume growth of 3.7 percent.
Cost of sales, measured as a percent of net sales, was 51.9 percent in 2010, a decrease of 0.5 percentage points
from 2009. A number of positive factors impacted year-on-year results. These factors included 13.7 percent growth in
organic sales volume, improved factory utilization levels, along with cost savings related to prior years’ restructuring
actions. In addition, 2009 included a penalty of 0.5 percentage points (as a percent of net sales) related to special
items. As discussed in Note 4 (Restructuring Actions), in 2009, 3M recorded $209 million in restructuring charges, of
which $110 million was recorded in cost of sales. This was partially offset by a $15 million gain on sale of a New
Jersey roofing granule facility, which was also recorded in cost of sales. In addition, 3M decided to swap Venezuelan
bolivars into U.S. dollars in 2009, given the economic conditions in Venezuela at that time, which also negatively
impacted cost of sales in 2009. These year-on-year net benefits were partially offset by pricing impacts, as selling
prices declined 0.2 percent year-on-year, and gross raw material prices increased approximately 2 percent year-on-
year.
Selling, General and Administrative Expenses:
Selling, general and administrative (SG&A) expenses increased 13 percent in 2011 when compared to 2010, due to
several factors. Approximately 5 percentage points of this growth in SG&A was due to increases from businesses
acquired in the last twelve months, primarily related to SG&A spending for the Winterthur Technologie AG, Arizant
Inc., Cogent Inc. and Attenti Holdings S.A. acquisitions. Another 3 percentage points of growth in 2011 SG&A was
due to foreign exchange effects, which resulted in higher translated costs from 3M’s non-U.S. subsidiaries. Finally,
2011 SG&A increased in part due to higher year-on-year pension and postretirement expense and continued
investments to support future growth, such as sales representatives, advertising and promotional investments. SG&A
expenses, measured as a percent of net sales, increased 0.3 percentage points in 2011 compared to 2010.
Selling, general and administrative (SG&A) expenses increased 12 percent in 2010 when compared to 2009. In
2010, sales and marketing expenses increased 14 percent, which included advertising and promotion investment
increases of over 20 percent in 2010, which helped drive sales volumes. In addition, 3M increased both sales
coverage and its marketing strength, particularly in faster-growing emerging economies. In 2010, general and
administrative costs remained under control, as these costs increased at approximately half the rate of 2010 sales
growth. SG&A expenses, measured as a percent of net sales, decreased 0.7 percentage points in 2010 compared to
2009. As indicated in Note 4, restructuring expenses of $91 million were recorded in SG&A expenses in 2009.
Measured as a percent of sales, these restructuring expenses increased 2009 SG&A expenses by 0.4 percentage
points.
Research, Development and Related Expenses:
Research, development and related expenses (R&D) expense increased 9.5 percent in 2011 compared to 2010, and
increased 11 percent in 2010 compared to 2009, as 3M continued to support its key growth initiatives. In 2011, R&D
expense increased versus 2010 due to R&D related to businesses acquired in the last 12 months, foreign exchange
effects, and higher pension and postretirement expense, in addition to 3M’s continued investment in new products.
R&D, measured as a percent of sales, was 5.3 percent in 2011, compared to 5.4 percent in 2010 and 5.6 percent in
2009.
Operating Income:
3M uses operating income as one of its primary business segment performance measurement tools. Operating
income was 20.9 percent of sales in 2011, compared to 22.2 percent of sales in 2010, primarily due to higher cost of