3M 2011 Annual Report Download - page 26
Download and view the complete annual report
Please find page 26 of the 2011 3M annual report below. You can navigate through the pages in the report by either clicking on the pages listed below, or by using the keyword search tool below to find specific information within the annual report.-
 1
1 -
2
-
3
-
4
-
5
-
6
-
7
-
8
-
9
-
10
-
11
-
12
-
13
-
14
-
15
-
 16
16 -
 17
17 -
 18
18 -
 19
19 -
 20
20 -
 21
21 -
 22
22 -
 23
23 -
 24
24 -
 25
25 -
 26
26 -
 27
27 -
 28
28 -
 29
29 -
 30
30 -
 31
31 -
 32
32 -
 33
33 -
 34
34 -
 35
35 -
 36
36 -
37
-
38
-
39
-
40
-
41
-
42
-
43
-
44
-
45
-
46
-
47
-
48
-
49
-
50
-
51
-
52
-
53
-
54
-
55
-
56
-
57
-
58
-
59
-
60
-
61
-
62
-
63
-
64
-
65
-
66
-
67
-
68
-
69
-
70
-
71
-
72
-
73
-
74
-
75
-
76
-
77
-
78
-
79
-
80
-
81
-
82
-
83
-
84
-
85
-
86
-
87
-
88
-
89
-
90
-
91
-
92
-
93
-
94
-
95
-
96
-
97
-
98
-
99
-
100
-
101
-
102
-
103
-
104
-
105
-
106
-
107
-
108
-
109
-
110
-
111
-
112
-
113
-
114
-
115
-
116
-
117
-
118
-
119
-
120
-
121
-
122
-
123
-
124
-
125
-
126
-
127
-
128
-
129
-
130
-
131
-
132
 |
 |

20
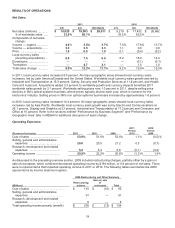
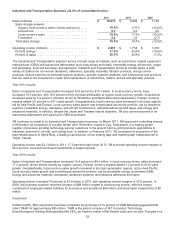
sales (as a percent of sales) in 2011 when compared to 2010. Operating income was 20.8 percent of sales in 2009.
2009 was negatively impacted by restructuring expenses, net of a gain on sale of real estate, which on a combined
basis decreased operating income by 0.9 percentage points ($194 million).
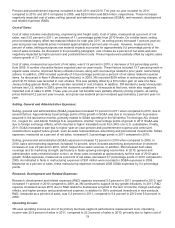
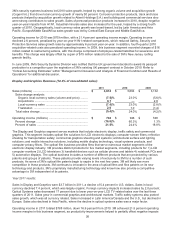
Interest Expense and Income:
(Millions) 2011 2010 2009
Interest expense ...................................................................... $ 186
$ 201 $ 219
Interest income ........................................................................ (39 ) (38) (37 )
Total ..................................................................................... $ 147
$ 163 $ 182
Interest Expense: Interest expense decreased in both 2011 and 2010, driven by lower average U.S. debt balances
and lower interest rates.
Interest Income: In 2011, interest income increased slightly, as higher international cash balances and better
investment yields were largely offset by a lower U.S. cash balance. In 2010, interest income also increased slightly,
with higher average cash and cash equivalent balances largely offset by lower interest rates.
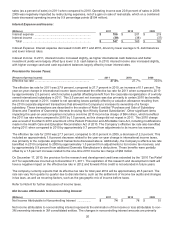
Provision for Income Taxes:
(Percent of pre-tax income) 2011 2010 2009
Effective tax rate .................................................................... 27.8% 27.7% 30.0 %
The effective tax rate for 2011 was 27.8 percent, compared to 27.7 percent in 2010, an increase of 0.1 percent. The
year-on-year change in international income taxes increased the effective tax rate for 2011 when compared to 2010
by approximately 2.5 percent, which includes a partial offsetting benefit from the corporate reorganization of a wholly
owned international subsidiary in 2011. This 2.5 percent net increase was due primarily to certain 2010 tax benefits,
which did not repeat in 2011, related to net operating losses partially offset by a valuation allowance resulting from
the 2010 corporate alignment transactions that allowed the Company to increase its ownership of a foreign
subsidiary. These transactions are described in the section of Note 6 entitled “Purchase and Sale of Subsidiary
Shares and Transfers of Ownership Interests Involving Non-Wholly Owned Subsidiaries”. Other significant items
impacting the year-on-year comparison include a one-time 2010 income tax charge of $84 million, which benefited
the 2011 tax rate when compared to 2010 by 1.5 percent, as this charge did not repeat in 2011. This 2010 charge
was a result of the March 2010 enactment of the Patient Protection and Affordable Care Act, including modifications
made in the Health Care and Education Reconciliation Act of 2010. The Company’s effective tax rate also benefited
during 2011 when compared to 2010 by approximately 0.7 percent from adjustments to its income tax reserves.
The effective tax rate for 2010 was 27.7 percent, compared to 30.0 percent in 2009, a decrease of 2.3 percent. This
included an approximately 1.8 percent decrease related to the year-on-year change in international income taxes,
due primarily to the corporate alignment transactions discussed above. Additionally, the Company’s effective tax rate
benefited in 2010 compared to 2009 by approximately 1.3 percent from adjustments to its income tax reserves, and
by approximately 0.9 percent from additional Domestic Manufacturer’s deductions. These benefits were partially
offset by a 1.5 percent increase related to the one-time 2010 income tax charge of $84 million.
On December 17, 2010, the provision for the research and development credit was extended by the “2010 Tax Relief
Act” for expenditures incurred up to December 31, 2011. The expiration of this research and development credit will
have a negative impact on the effective tax rate in 2012 and forward if this credit is not extended in future years.
The company currently expects that its effective tax rate for total year 2012 will be approximately 29.5 percent. The
rate can vary from quarter to quarter due to discrete items, such as the settlement of income tax audits and changes
in tax laws, as well as recurring factors, such as the geographic mix of income before taxes.
Refer to Note 8 for further discussion of income taxes.
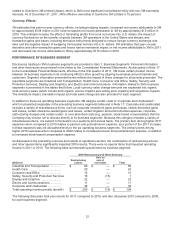
Net Income Attributable to Noncontrolling Interest:
(Millions) 2011 2010 2009
Net Income Attributable to Noncontrolling Interest ................. $ 74
$ 78 $ 51
Net income attributable to noncontrolling interest represents the elimination of the income or loss attributable to non-
3M ownership interests in 3M consolidated entities. The changes in noncontrolling interest amounts are primarily