3M 2011 Annual Report Download - page 55
Download and view the complete annual report
Please find page 55 of the 2011 3M annual report below. You can navigate through the pages in the report by either clicking on the pages listed below, or by using the keyword search tool below to find specific information within the annual report.-
 1
1 -
2
-
3
-
4
-
5
-
6
-
7
-
8
-
9
-
10
-
11
-
12
-
13
-
14
-
15
-
16
-
17
-
18
-
19
-
20
-
21
-
22
-
23
-
24
-
25
-
26
-
27
-
28
-
29
-
30
-
31
-
32
-
33
-
34
-
35
-
36
-
37
-
38
-
39
-
40
-
41
-
42
-
43
-
44
-
 45
45 -
 46
46 -
 47
47 -
 48
48 -
 49
49 -
 50
50 -
 51
51 -
 52
52 -
 53
53 -
 54
54 -
 55
55 -
 56
56 -
 57
57 -
 58
58 -
 59
59 -
 60
60 -
 61
61 -
 62
62 -
 63
63 -
 64
64 -
 65
65 -
66
-
67
-
68
-
69
-
70
-
71
-
72
-
73
-
74
-
75
-
76
-
77
-
78
-
79
-
80
-
81
-
82
-
83
-
84
-
85
-
86
-
87
-
88
-
89
-
90
-
91
-
92
-
93
-
94
-
95
-
96
-
97
-
98
-
99
-
100
-
101
-
102
-
103
-
104
-
105
-
106
-
107
-
108
-
109
-
110
-
111
-
112
-
113
-
114
-
115
-
116
-
117
-
118
-
119
-
120
-
121
-
122
-
123
-
124
-
125
-
126
-
127
-
128
-
129
-
130
-
131
-
132
 |
 |

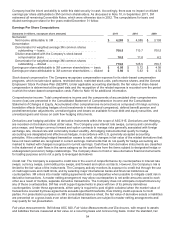
49
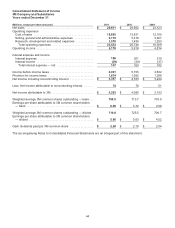
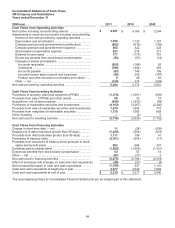
Consolidated Statement of Cash Flows
3M Company and Subsidiaries
Years ended December 31
(Millions) 2011 2010 2009
Cash Flows from Operating Activities
Net income including noncontrolling interest .......................... $ 4,357
$ 4,163 $ 3,244
A
djustments to reconcile net income including noncontrolling
interest to net cash provided by operating activities ............
Depreciation and amortization ............................................. 1,236
1,120 1,157
Company pension and postretirement contributions ........... (582 ) (618) (792 )
Company pension and postretirement expense .................. 555
322 223
Stock-based compensation expense ................................... 253
274 217
Deferred income taxes ........................................................ 177
(170) 701
Excess tax benefits from stock-based compensation ......... (53 ) (53) (14 )
Changes in assets and liabilities .........................................
Accounts receivable ......................................................... (205 ) (189) 55
Inventories ........................................................................ (196 ) (404) 453
Accounts payable ............................................................. (83 ) 146 109
Accrued income taxes (current and long-term) ................ (45 ) 255 (147 )
Product and other insurance receivables and claims ...... 9
49 64
Other — net ......................................................................... (139 ) 279 (329 )
Net cash provided by operating activities ................................ 5,284
5,174 4,941
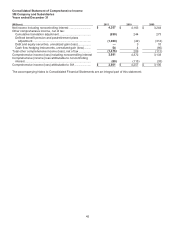
Cash Flows from Investing Activities
Purchases of property, plant and equipment (PP&E) ............. (1,379 ) (1,091) (903 )
Proceeds from sale of PP&E and other assets ....................... 55
25 74
A
cquisitions, net of cash acquired ........................................... (649 ) (1,830) (69 )
Purchases of marketable securities and investments ............. (4,162 ) (3,287) (2,240 )
Proceeds from sale of marketable securities and investments 1,679
1,995 718
Proceeds from maturities of marketable securities ................. 1,738
1,565 683
Other investing ........................................................................ —
(3) 5
Net cash used in investing activities ....................................... (2,718 ) (2,626) (1,732 )
Cash Flows from Financing Activities
Change in short-term debt — net ............................................ 11
(24) (536 )
Repayment of debt (maturities greater than 90 days) ............. (1,429 ) (556) (519 )
Proceeds from debt (maturities greater than 90 days) ............ 1,111
108 41
Purchases of treasury stock .................................................... (2,701 ) (854) (17 )
Proceeds from issuances of treasury stock pursuant to stock
option and benefit plans ...................................................... 902
666 431
Dividends paid to shareholders ............................................... (1,555 ) (1,500) (1,431 )
Excess tax benefits from stock-based compensation ............. 53
53 14
Other — net ............................................................................. (67 ) (77) 3
Net cash used in financing activities ....................................... (3,675 ) (2,184) (2,014 )
Effect of exchange rate changes on cash and cash equivalents (49 ) (27) (4 )
Net increase/(decrease) in cash and cash equivalents .......... (1,158 ) 337 1,191
Cash and cash equivalents at beginning of year .................... 3,377
3,040 1,849
Cash and cash equivalents at end of year .............................. $ 2,219
$ 3,377 $ 3,040
The accompanying Notes to Consolidated Financial Statements are an integral part of this statement.