3M 2011 Annual Report Download - page 3
Download and view the complete annual report
Please find page 3 of the 2011 3M annual report below. You can navigate through the pages in the report by either clicking on the pages listed below, or by using the keyword search tool below to find specific information within the annual report.-
 1
1 -
 2
2 -
 3
3 -
 4
4 -
 5
5 -
 6
6 -
 7
7 -
 8
8 -
 9
9 -
 10
10 -
 11
11 -
 12
12 -
 13
13 -
 14
14 -
15
-
16
-
17
-
18
-
19
-
20
-
21
-
22
-
23
-
24
-
25
-
26
-
27
-
28
-
29
-
30
-
31
-
32
-
33
-
34
-
35
-
36
-
37
-
38
-
39
-
40
-
41
-
42
-
43
-
44
-
45
-
46
-
47
-
48
-
49
-
50
-
51
-
52
-
53
-
54
-
55
-
56
-
57
-
58
-
59
-
60
-
61
-
62
-
63
-
64
-
65
-
66
-
67
-
68
-
69
-
70
-
71
-
72
-
73
-
74
-
75
-
76
-
77
-
78
-
79
-
80
-
81
-
82
-
83
-
84
-
85
-
86
-
87
-
88
-
89
-
90
-
91
-
92
-
93
-
94
-
95
-
96
-
97
-
98
-
99
-
100
-
101
-
102
-
103
-
104
-
105
-
106
-
107
-
108
-
109
-
110
-
111
-
112
-
113
-
114
-
115
-
116
-
117
-
118
-
119
-
120
-
121
-
122
-
123
-
124
-
125
-
126
-
127
-
128
-
129
-
130
-
131
-
132
 |
 |

$25
$20
$15
$10
$6.00
$4.00
$2.00
0
0
$2.00
$2.50
$1.50
$1.00
$30
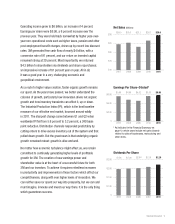
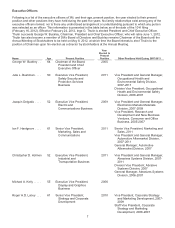
Net Sales (billions)
Earnings Per Share–Diluted*
Dividends Per Share
* As indicated in the Financial Summary on
page 4, certain years include net gains (losses)
related to sales of businesses, restructuring and
other items.
2011
$2.20
20102007 2008 2009
$1.92 $2.00 $2.04 $2.10
2011
$5.96
2011
$29.6
2007 2008 2009 2010
$24.5 $25.3 $23.1 $26.7
2007 2008 2009
$5.60 $4.89 $4.52
2010
$5.63
Inspired Innovation 1
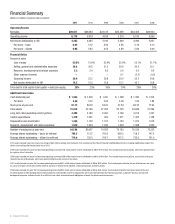
Operating income grew to $6 billion, an increase of 4 percent.
Earnings per share were $5.96, a 6 percent increase over the
previous year. They were held back somewhat by higher year-over-
year non-operational costs such as higher taxes, pension and other
post employment benefit charges, driven up by record low discount
rates. 3M generated free cash flow of nearly $4 billion, with a
conversion rate of 91 percent, and our return on invested capital
remained strong at 20 percent. Most importantly, we returned
$4.3 billion to shareholders via dividends and share repurchases;
an impressive increase of 81 percent year on year. All in all,
it was a good year in a very challenging economic and
geopolitical environment.
As a route to higher value creation, faster organic growth remains
our quest. As the years have passed, we better understand the
calculus of growth, particularly how innovation drives net organic
growth and how inventory transients can affect it, up or down.
The Industrial Production Index (IPI), which is the best baseline
measure of our effective end market, bounced around wildly
in 2011. The sharpest change came between Q1 and Q2 when
worldwide IPI fell from 5.6 percent to 3.2 percent, a 240 basis
point reduction. Distribution channels responded predictably by
cutting orders to drive excess inventory out of the system and that
pulled down growth. But the great news is that underlying organic
growth remained robust: growth is alive and well.
No matter how economic turbulence might affect us, we remain
committed to continually generating higher levels of profitable
growth for 3M. The creation of new earnings power and
shareholder value is at the heart of a successful future for both
3M and our investors. To achieve it requires relentless increases
in productivity and improvements in those factors which affect our
competitiveness, along with ever higher levels of innovation. We
can neither save nor spend our way into prosperity, but we can and
must imagine, innovate and invest our way there. It is the only thing
which guarantees success.