3M 2011 Annual Report Download - page 33
Download and view the complete annual report
Please find page 33 of the 2011 3M annual report below. You can navigate through the pages in the report by either clicking on the pages listed below, or by using the keyword search tool below to find specific information within the annual report.-
 1
1 -
2
-
3
-
4
-
5
-
6
-
7
-
8
-
9
-
10
-
11
-
12
-
13
-
14
-
15
-
16
-
17
-
18
-
19
-
20
-
21
-
22
-
 23
23 -
 24
24 -
 25
25 -
 26
26 -
 27
27 -
 28
28 -
 29
29 -
 30
30 -
 31
31 -
 32
32 -
 33
33 -
 34
34 -
 35
35 -
 36
36 -
 37
37 -
 38
38 -
 39
39 -
 40
40 -
 41
41 -
 42
42 -
 43
43 -
44
-
45
-
46
-
47
-
48
-
49
-
50
-
51
-
52
-
53
-
54
-
55
-
56
-
57
-
58
-
59
-
60
-
61
-
62
-
63
-
64
-
65
-
66
-
67
-
68
-
69
-
70
-
71
-
72
-
73
-
74
-
75
-
76
-
77
-
78
-
79
-
80
-
81
-
82
-
83
-
84
-
85
-
86
-
87
-
88
-
89
-
90
-
91
-
92
-
93
-
94
-
95
-
96
-
97
-
98
-
99
-
100
-
101
-
102
-
103
-
104
-
105
-
106
-
107
-
108
-
109
-
110
-
111
-
112
-
113
-
114
-
115
-
116
-
117
-
118
-
119
-
120
-
121
-
122
-
123
-
124
-
125
-
126
-
127
-
128
-
129
-
130
-
131
-
132
 |
 |

27
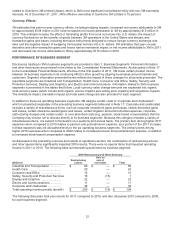
from lower sales of optical films for LCD TVs, impacted by LCD TV volume reductions, as well as continued LCD
selling price declines.
Year 2010 results:
Sales in Display and Graphics were $3.9 billion, up 24.0 percent year-on-year. Sales increased 23.0 percent in local
currencies, which was entirely organic. Foreign currency impacts increased sales growth by 1.0 percent. Sales rose
in all businesses, with the strongest growth in 3M’s optical systems and commercial graphics businesses. In the
fourth quarter of 2010, while sales growth moderated in optical films for LCD TVs, local-currency sales were still up
more than 10 percent year-on-year. Sales in 2010 were up slightly in the traffic safety systems business and mobile
interactive solutions division, which focuses on products that improve projection, personalization and privacy for
mobile device users. Geographically, sales growth was led by Asia Pacific, Latin America/Canada, and the United
States.
Operating income in 2010 totaled $946 million, or 24.4 percent of sales. In 2009, this business segment recorded net
charges of $22 million related to restructuring actions, with this charge comprised of employee-related liabilities for
severance and benefits and fixed asset impairments.
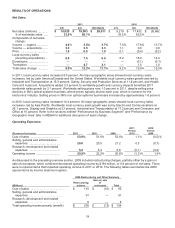
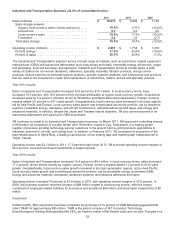
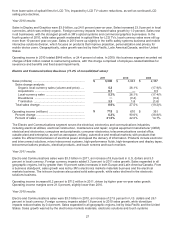
Electro and Communications Business (11.2% of consolidated sales):
2011 2010 2009
Sales (millions) ................................................................ $ 3,306
$ 3,043 $ 2,387
Sales change analysis:
Organic local-currency sales (volume and price) ..... 5.2
26.1 % (17.9 )%
Acquisitions .............................................................. 0.1
— 0.5
Local-currency sales ................................................ 5.3 % 26.1 % (17.4 )%
Divestitures .............................................................. —
(0.4 ) (0.2 )
Translation ............................................................... 3.3
1.8 (1.6 )
Total sales change ....................................................... 8.6 % 27.5 % (19.2 )%
Operating income (millions) ............................................ $ 712
$ 670 $ 351
Percent change ............................................................ 6.2 % 90.6 % (38.8 )%
Percent of sales ........................................................... 21.5 % 22.0 % 14.7 %
The Electro and Communications segment serves the electrical, electronics and communications industries,
including electrical utilities; electrical construction, maintenance and repair; original equipment manufacturer (OEM)
electrical and electronics; computers and peripherals; consumer electronics; telecommunications central office,
outside plant and enterprise; as well as aerospace, military, automotive and medical markets; with products that
enable the efficient transmission of electrical power and speed the delivery of information. Products include electronic
and interconnect solutions, micro interconnect systems, high-performance fluids, high-temperature and display tapes,
telecommunications products, electrical products, and touch screens and touch monitors.
Year 2011 results:
Electro and Communications sales were $3.3 billion in 2011, an increase of 8.6 percent in U.S. dollars and 5.3
percent in local currency. Foreign currency impacts added 3.3 percent to 2011 sales growth. Sales expanded in all
geographic regions, led by greater than 10 percent sales increases in both Europe and Latin America/Canada. From
a business standpoint, sales growth was led by 3M’s electronics markets materials business and the electrical
markets business. The telecom business also posted solid sales growth, while sales declined in the electronic
solutions business.
Operating income increased 6.2 percent to $712 million in 2011, driven by higher year-on-year sales growth.
Operating income margins were 21.5 percent, slightly lower than 2010.
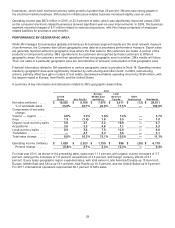
Year 2010 results:
Electro and Communications sales were $3.0 billion in 2010, an increase of 27.5 percent in U.S. dollars and 26.1
percent in local currency. Foreign currency impacts added 1.8 percent to 2010 sales growth, while divestiture
impacts reduced sales by 0.4 percent. Sales expanded in all geographic regions, led by Asia Pacific and the United
States. Sales growth was led by the electronics markets materials, electronic solutions and touch systems