3M 2011 Annual Report Download - page 28
Download and view the complete annual report
Please find page 28 of the 2011 3M annual report below. You can navigate through the pages in the report by either clicking on the pages listed below, or by using the keyword search tool below to find specific information within the annual report.-
 1
1 -
2
-
3
-
4
-
5
-
6
-
7
-
8
-
9
-
10
-
11
-
12
-
13
-
14
-
15
-
16
-
17
-
 18
18 -
 19
19 -
 20
20 -
 21
21 -
 22
22 -
 23
23 -
 24
24 -
 25
25 -
 26
26 -
 27
27 -
 28
28 -
 29
29 -
 30
30 -
 31
31 -
 32
32 -
 33
33 -
 34
34 -
 35
35 -
 36
36 -
 37
37 -
 38
38 -
39
-
40
-
41
-
42
-
43
-
44
-
45
-
46
-
47
-
48
-
49
-
50
-
51
-
52
-
53
-
54
-
55
-
56
-
57
-
58
-
59
-
60
-
61
-
62
-
63
-
64
-
65
-
66
-
67
-
68
-
69
-
70
-
71
-
72
-
73
-
74
-
75
-
76
-
77
-
78
-
79
-
80
-
81
-
82
-
83
-
84
-
85
-
86
-
87
-
88
-
89
-
90
-
91
-
92
-
93
-
94
-
95
-
96
-
97
-
98
-
99
-
100
-
101
-
102
-
103
-
104
-
105
-
106
-
107
-
108
-
109
-
110
-
111
-
112
-
113
-
114
-
115
-
116
-
117
-
118
-
119
-
120
-
121
-
122
-
123
-
124
-
125
-
126
-
127
-
128
-
129
-
130
-
131
-
132
 |
 |

22
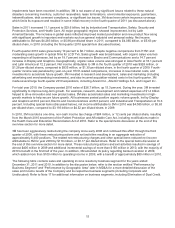
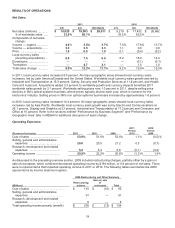
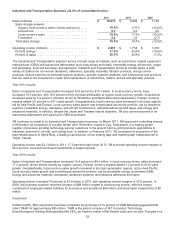
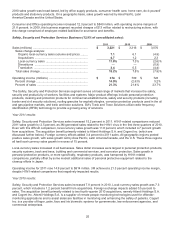
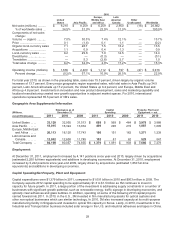
Industrial and Transportation Business (34.0% of consolidated sales):
2011 2010 2009
Sales (millions) ..................................................................... $ 10,073
$ 8,429 $ 7,120
Sales change analysis:
Organic local-currency sales (volume and price) ..... 10.0 % 17.0% (12.8 )%
Acquisitions .................................... 5.9
0.2 2.6
Local-currency sales ............................. 15.9 % 17.2% (10.2 )%
Translation ..................................... 3.6
1.2 (2.7 )
Total sales change ................................ 19.5 % 18.4% (12.9 )%
Operating income (millions) ........................... $ 2,057
$ 1,754 $ 1,230
Percent change ................................... 17.3 % 42.6% (19.9 )%
Percent of sales .................................. 20.4 % 20.8% 17.3 %
The Industrial and Transportation segment serves a broad range of markets, such as automotive original equipment
manufacturer (OEM) and automotive aftermarket (auto body shops and retail), renewable energy, electronics, paper
and packaging, food and beverage, and appliance. Industrial and Transportation products include tapes, a wide
variety of coated and non-woven abrasives, adhesives, specialty materials, filtration products, energy control
products, closure systems for personal hygiene products, acoustic systems products, and components and products
that are used in the manufacture, repair and maintenance of automotive, marine, aircraft and specialty vehicles.
Year 2011 results:
Sales in Industrial and Transportation increased 19.5 percent to $10.1 billion. In local-currency terms, sales
increased 15.9 percent, with 10.0 percent of this increase attributable to organic local-currency growth. Acquisitions
increased sales by 5.9 percent, primarily driven by Winterthur and Alpha Beta (discussed below). Foreign currency
impacts added 3.6 percent to 2011 sales growth. Geographically, local-currency sales increased in all major regions,
led by Asia Pacific and Europe. Local-currency sales growth was broad-based across the portfolio, led by abrasives
systems, renewable energy, aerospace and aircraft maintenance, industrial adhesives and tapes, and energy and
advanced materials. In addition, despite the Japan and Thailand natural disasters, 3M also achieved growth in its
automotive aftermarket and automotive OEM businesses.
3M continues to invest in its Industrial and Transportation business. In March 2011, 3M acquired a controlling interest
in Winterthur via completion of a public tender offer. Winterthur, based in Zug, Switzerland, is a leading global
supplier of precision grinding technology serving customers in the area of hard-to-grind precision applications in
industrial, automotive, aircraft, and cutting tools. In addition, in February 2011, 3M completed its acquisition of the
tape-related assets of Alpha Beta, a leading manufacturer of box sealing tape and masking tape headquartered in
Taipei, Taiwan.
Operating income was $2.1 billion in 2011, 17.3 percent higher than 2010. 3M achieved operating income margins of
20.4 percent, even with continued investments to support growth.
Year 2010 results:
Sales in Industrial and Transportation increased 18.4 percent to $8.4 billion. In local-currency terms, sales increased
17.2 percent, driven almost entirely by organic volume. Foreign currency impacts added 1.2 percent to 2010 sales
growth. Geographically, local-currency sales growth increased in all major geographic regions, led by Asia Pacific.
Local-currency sales growth was broad-based across the portfolio, led by renewable energy, automotive OEM,
energy and advanced materials, aerospace, abrasives systems, and industrial adhesives and tapes.
Operating income increased 43 percent to $1.8 billion in 2010, with operating income margins of 20.8 percent. In
2009, this business segment recorded charges of $89 million related to restructuring actions, with this charge
comprised of employee-related liabilities for severance and benefits of $84 million and fixed asset impairments of $5
million.
Investment:
In March 2005, 3M’s automotive business completed the purchase of 19 percent of TI&M Beteiligungsgesellschaft
mbH (TI&M) for approximately $55 million. TI&M is the parent company of I&T Innovation Technology
Entwicklungsund Holding Aktiengesellschaft (I&T), an Austrian maker of flat flexible cable and circuitry. Pursuant to a