Westjet 2015 Annual Report Download - page 90
Download and view the complete annual report
Please find page 90 of the 2015 Westjet annual report below. You can navigate through the pages in the report by either clicking on the pages listed below, or by using the keyword search tool below to find specific information within the annual report.-
 1
1 -
2
-
3
-
4
-
5
-
6
-
7
-
8
-
9
-
10
-
11
-
12
-
13
-
14
-
15
-
16
-
17
-
18
-
19
-
20
-
21
-
22
-
23
-
24
-
25
-
26
-
27
-
28
-
29
-
30
-
31
-
32
-
33
-
34
-
35
-
36
-
37
-
38
-
39
-
40
-
41
-
42
-
43
-
44
-
45
-
46
-
47
-
48
-
49
-
50
-
51
-
52
-
53
-
54
-
55
-
56
-
57
-
58
-
59
-
60
-
61
-
62
-
63
-
64
-
65
-
66
-
67
-
68
-
69
-
70
-
71
-
72
-
73
-
74
-
75
-
76
-
77
-
78
-
79
-
 80
80 -
 81
81 -
 82
82 -
 83
83 -
 84
84 -
 85
85 -
 86
86 -
 87
87 -
 88
88 -
 89
89 -
 90
90 -
 91
91 -
 92
92 -
 93
93 -
 94
94 -
 95
95 -
 96
96 -
 97
97 -
 98
98 -
 99
99 -
 100
100 -
101
 |
 |

Notes to Consolidated Financial Statements
As at and for the years ended December 31, 2015 and 2014
(Stated in thousands of Canadian dollars, except percentage, ratio, share and per share amounts)
WestJet Annual Report 2015 | 88
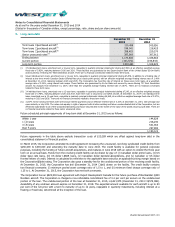
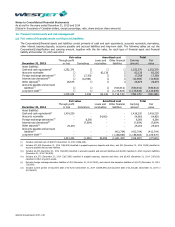
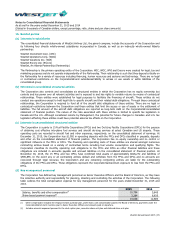
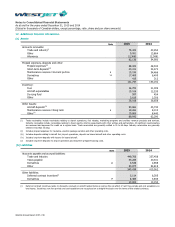
14. Financial instruments and risk management
(a) Fair value of financial assets and financial liabilities
The Corporation’s financial assets and liabilities consist primarily of cash and cash equivalents, accounts receivable, derivatives,
other interest bearing deposits, accounts payable and accrued liabilities and long-term debt. The following tables set out the
Corporation’s classification and carrying amount, together with the fair value, for each type of financial asset and financial
liability at December 31, 2015 and 2014:
Fair value
Amortized cost
Total
December 31, 2015
Through profit
or loss
Derivatives
Loans and
receivables
Other financial
liabilities
Carrying
amount
Fair
value
Asset (liability):
Cash and cash equivalents(i)
1,252,370
–
–
–
1,252,370
1,252,370
Accounts receivable
–
–
82,136
–
82,136
82,136
Foreign exchange derivatives(ii)
–
17,358
–
–
17,358
17,358
Interest rate derivatives(iii)
–
(12,964)
–
–
(12,964)
(12,964)
Other deposits(iv)
26,675
–
–
–
26,675
26,675
Accounts payable and accrued
liabilities
(v)
–
–
–
(540,912)
(540,912)
(540,912)
Long-term debt(vi)
–
–
–
(1,174,833)
(1,174,833)
(1,124,849)
1,279,045
4,394
82,136
(1,715,745)
(350,170)
(300,186)
Fair value
Amortized cost
Total
December 31, 2014
Through profit
or loss
Derivatives
Loans and
receivables
Other financial
liabilities
Carrying
amount
Fair
value
Asset (liability):
Cash and cash equivalents(i)
1,416,220
−
−
−
1,416,220
1,416,220
Accounts receivable
−
−
54,950
−
54,950
54,950
Foreign exchange derivatives(ii)
−
6,360
−
−
6,360
6,360
Interest rate derivatives(iii)
−
(7,654)
−
−
(7,654)
(7,654)
Other deposits(iv)
25,204
−
−
−
25,204
25,204
Accounts payable and accrued
liabilities
(v)
−
−
−
(412,704)
(412,704)
(412,704)
Long-term debt(vi)
−
−
−
(1,188,663)
(1,188,663)
(1,109,970)
1,441,424
(1,294)
54,950
(1,601,367)
(106,287)
(27,594)
(i) Includes restricted cash of $68,573 (December 31, 2014 – $58,149).
(ii) Includes $17,409 (December 31, 2014 – $6,409) classified in prepaid expenses, deposits and other, and $51 (December 31, 2014 – $49) classified in
accounts payable and accrued liabilities.
(iii) Includes $4,475 (December 31, 2014 – $2,809) classified in accounts payable and accrued liabilities and $8,489 classified in other long-term liabilities
(December 31, 2014 – $4,845).
(iv) Includes $21,275 (December 31, 2014 – $17,585) classified in prepaid expenses, deposits and other, and $5,400 (December 31, 2014 – $7,619)
classified in other long-term assets.
(v) Excludes foreign exchange derivative liabilities of $51 (December 31, 2014 – $49), and interest rate derivative liabilities of $4,475 (December 31, 2014
– $2,809).
(vi) Includes current portion of long-term debt of $141,572 (December 31, 2014 – $159,843) and long-term debt of $1,033,261 (December 31, 2014 –
$1,028,820).