Westjet 2015 Annual Report Download - page 24
Download and view the complete annual report
Please find page 24 of the 2015 Westjet annual report below. You can navigate through the pages in the report by either clicking on the pages listed below, or by using the keyword search tool below to find specific information within the annual report.-
 1
1 -
2
-
3
-
4
-
5
-
6
-
7
-
8
-
9
-
10
-
11
-
12
-
13
-
 14
14 -
 15
15 -
 16
16 -
 17
17 -
 18
18 -
 19
19 -
 20
20 -
 21
21 -
 22
22 -
 23
23 -
 24
24 -
 25
25 -
 26
26 -
 27
27 -
 28
28 -
 29
29 -
 30
30 -
 31
31 -
 32
32 -
 33
33 -
 34
34 -
35
-
36
-
37
-
38
-
39
-
40
-
41
-
42
-
43
-
44
-
45
-
46
-
47
-
48
-
49
-
50
-
51
-
52
-
53
-
54
-
55
-
56
-
57
-
58
-
59
-
60
-
61
-
62
-
63
-
64
-
65
-
66
-
67
-
68
-
69
-
70
-
71
-
72
-
73
-
74
-
75
-
76
-
77
-
78
-
79
-
80
-
81
-
82
-
83
-
84
-
85
-
86
-
87
-
88
-
89
-
90
-
91
-
92
-
93
-
94
-
95
-
96
-
97
-
98
-
99
-
100
-
101
 |
 |

WestJet Annual Report 2015 | 22
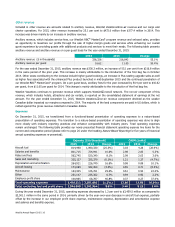
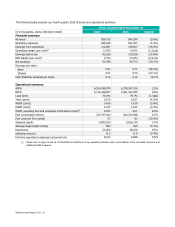
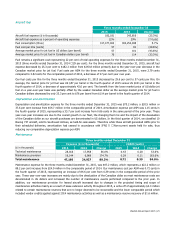
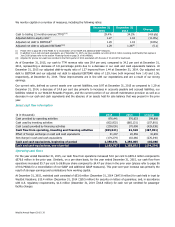
The following table presents our fourth quarter 2015 financial and operational summary:
Three months ended December 31
($ in thousands, unless otherwise noted)
2015
2014
Change
Financial summary
Revenue 958,715
994,394
(3.6%)
Operating expenses 846,028
854,787
(1.0%)
Earnings from operations 112,687
139,607
(19.3%)
Operating margin (per cent)(i)
11.8%
14.0%
(2.2 pts)
Earnings before tax 92,628
124,816
(25.8%)
EBT margin (per cent)
(i)
9.7% 12.6% (2.9 pts)
Net earnings
63,436
90,713
(30.1%)
Earnings per share:
Basic
0.51
0.71
(28.2%)
Diluted
0.51
0.70
(27.1%)
Cash dividends declared per share 0.14 0.12 16.7%
Operational summary
ASMs
6,524,788,975
6,378,247,018
2.3%
RPMs 5,114,188,857
5,081,440,294
0.6%
Load factor 78.4% 79.7% (1.3pts)
Yield (cents) 18.75
19.57
(4.2%)
RASM (cents) 14.69
15.59
(5.8%)
CASM (cents)
12.97
13.40
(3.2%)
CASM, excluding fuel and employee profit share (cents)
(i)
10.04
9.21
9.0%
Fuel consumption (litres) 317,477,003
300,254,948
5.7%
Fuel costs per litre (cents) 57
81
(29.6%)
Segment guests 4,893,020
4,826,149
1.4%
Average stage length (miles)
887
925
(4.1%)
Departures 53,284 48,676 9.5%
Utilization (hours)
11.2
11.6
(3.4%)
Full-time equivalent employees at period end
9,211
8,698
5.9%
(i) Please refer to page 55 and 56 of this MD&A for definitions of key operating indicators and a reconciliation of the non-GAAP measures and
additional GAAP measures.