Westjet 2015 Annual Report Download - page 31
Download and view the complete annual report
Please find page 31 of the 2015 Westjet annual report below. You can navigate through the pages in the report by either clicking on the pages listed below, or by using the keyword search tool below to find specific information within the annual report.-
 1
1 -
2
-
3
-
4
-
5
-
6
-
7
-
8
-
9
-
10
-
11
-
12
-
13
-
14
-
15
-
16
-
17
-
18
-
19
-
20
-
 21
21 -
 22
22 -
 23
23 -
 24
24 -
 25
25 -
 26
26 -
 27
27 -
 28
28 -
 29
29 -
 30
30 -
 31
31 -
 32
32 -
 33
33 -
 34
34 -
 35
35 -
 36
36 -
 37
37 -
 38
38 -
 39
39 -
 40
40 -
 41
41 -
42
-
43
-
44
-
45
-
46
-
47
-
48
-
49
-
50
-
51
-
52
-
53
-
54
-
55
-
56
-
57
-
58
-
59
-
60
-
61
-
62
-
63
-
64
-
65
-
66
-
67
-
68
-
69
-
70
-
71
-
72
-
73
-
74
-
75
-
76
-
77
-
78
-
79
-
80
-
81
-
82
-
83
-
84
-
85
-
86
-
87
-
88
-
89
-
90
-
91
-
92
-
93
-
94
-
95
-
96
-
97
-
98
-
99
-
100
-
101
 |
 |

WestJet Annual Report 2015 | 29
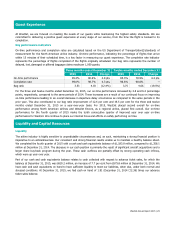
Guest Experience
At WestJet, we are focused on meeting the needs of our guests while maintaining the highest safety standards. We are
committed to delivering a positive guest experience at every stage of our service, from the time the flight is booked to its
completion.
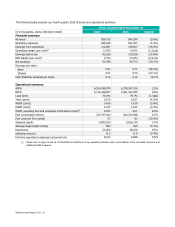
Key performance indicators
On-time performance and completion rates are calculated based on the US Department of Transportation’s standards of
measurement for the North American airline industry. On-time performance, indicating the percentage of flights that arrive
within 15 minutes of their scheduled time, is a key factor in measuring our guest experience. The completion rate indicator
represents the percentage of flights completed of the flights originally scheduled. Our bag ratio represents the number of
delayed, lost, damaged or pilfered baggage claims made per 1,000 guests.
Three months ended December 31
Twelve months ended December 31
2015 2014 Change 2015 2014 Change
On-time performance
85.4%
80.6%
4.8 pts.
85.3%
78.9%
6.4 pts.
Completion rate 99.0% 98.7% 0.3 pts. 98.6% 98.6% ―
Bag ratio
3.53
4.03
(12.4%)
3.75
4.66
(19.5%)
For the three and twelve months ended December 31, 2015, our on-time performance increased by 4.8 and 6.4 percentage
points, respectively, compared to the same periods of 2014. These increases are a result of our continued focus on improving
on-time performance leading to an overall decrease in departure delay occurrences as compared to the same periods in the
prior year. This also contributed to our bag ratio improvement of 12.4 per cent and 19.5 per cent for the three and twelve
months ended December 31, 2015 on a year-over-year basis. For 2015, WestJet placed second overall for on-time
performance among North American airlines and WestJet Encore, as a regional airline, placed first overall. Our on-time
performance for the fourth quarter of 2015 marks the tenth consecutive quarter of improved year over year on-time
performance for WestJet. We continue to place our internal focus and efforts on safely performing on time.
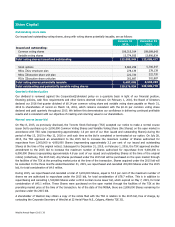
Liquidity and Capital Resources
Liquidity
The airline industry is highly sensitive to unpredictable circumstances and, as such, maintaining a strong financial position is
imperative to an airline’s success. Our consistent and strong financial results enable us to maintain a healthy balance sheet.
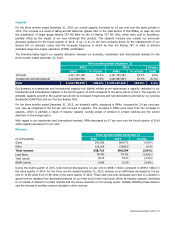
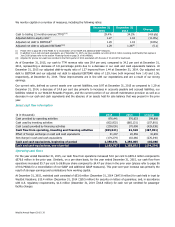
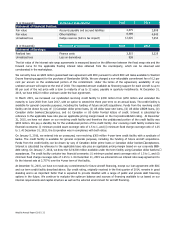
We completed the fourth quarter of 2015 with a cash and cash equivalents balance of $1,183.8 million, compared to $1,358.1
million at December 31, 2014. The decrease in our cash position is primarily the result of significant aircraft acquisitions and a
larger share buy-back program during the year. These cash outflows are partially offset by strong operating cash inflows,
which were up year over year.
Part of our cash and cash equivalents balance relates to cash collected with respect to advance ticket sales, for which the
balance at December 31, 2015, was $620.2 million, an increase of 7.7 per cent from $575.8 million at December 31, 2014. We
have cash and cash equivalents on hand to have sufficient liquidity to meet our liabilities, when due, under both normal and
stressed conditions. At December 31, 2015, we had cash on hand of 1.91 (December 31, 2014 – 2.36) times our advance
ticket sales balance.