Westjet 2015 Annual Report Download - page 16
Download and view the complete annual report
Please find page 16 of the 2015 Westjet annual report below. You can navigate through the pages in the report by either clicking on the pages listed below, or by using the keyword search tool below to find specific information within the annual report.-
 1
1 -
2
-
3
-
4
-
5
-
 6
6 -
 7
7 -
 8
8 -
 9
9 -
 10
10 -
 11
11 -
 12
12 -
 13
13 -
 14
14 -
 15
15 -
 16
16 -
 17
17 -
 18
18 -
 19
19 -
 20
20 -
 21
21 -
 22
22 -
 23
23 -
 24
24 -
 25
25 -
 26
26 -
27
-
28
-
29
-
30
-
31
-
32
-
33
-
34
-
35
-
36
-
37
-
38
-
39
-
40
-
41
-
42
-
43
-
44
-
45
-
46
-
47
-
48
-
49
-
50
-
51
-
52
-
53
-
54
-
55
-
56
-
57
-
58
-
59
-
60
-
61
-
62
-
63
-
64
-
65
-
66
-
67
-
68
-
69
-
70
-
71
-
72
-
73
-
74
-
75
-
76
-
77
-
78
-
79
-
80
-
81
-
82
-
83
-
84
-
85
-
86
-
87
-
88
-
89
-
90
-
91
-
92
-
93
-
94
-
95
-
96
-
97
-
98
-
99
-
100
-
101
 |
 |

WestJet Annual Report 2015 | 14
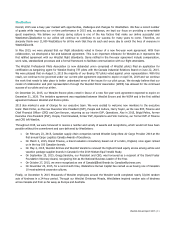
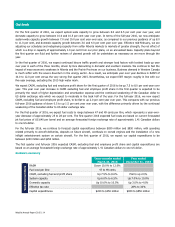
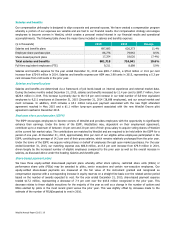
Outlook
For the first quarter of 2016, we expect system-wide capacity to grow between 6.0 and 6.5 per cent year over year, and
domestic capacity to grow between 10.0 and 10.5 per cent year over year. In terms of the full-year 2016, we now anticipate
system-wide capacity growth between 7.0 and 10.0 per cent year over year, as compared to our previous guidance of up 8.0
to 11.0 per cent, and domestic capacity growth between 3.0 and 4.0 per cent year over year. Effective mid-February, we are
adjusting our schedules and redeploying capacity from softer Alberta markets to markets of greater strength, the net effect of
which is a drop in capacity of approximately 1.0 per cent from our prior plans, on an annualized basis. Capacity plans beyond
the first quarter are fluid and further reviews of planned growth will be undertaken as necessary as we move through the
year.
In the first quarter of 2016, we expect continued leisure traffic growth and stronger load factors with booked loads up year
over year in each of the three months, driven by fare discounting in domestic and southern markets. We continue to feel the
impact of macroeconomic weakness in Alberta and the Prairie Provinces on our business. Business demand in Western Canada
is much softer with the severe downturn in the energy sector. As a result, we anticipate year over year declines in RASM of
10.0 to 12.0 per cent versus the very strong first quarter 2015. Nevertheless, we expect EBT margin roughly in line with our
five-year average, excluding the 2015 high water mark.
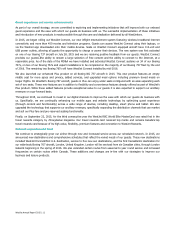
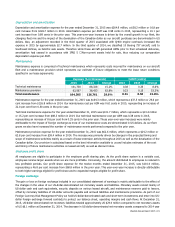
We expect CASM, excluding fuel and employee profit share for the first quarter of 2016 to be up 7.5 to 8.0 per cent year over
year. This year over year increase in CASM excluding fuel and employee profit share in the first quarter is expected to be
primarily the result of higher depreciation and amortization expense and the continued weakening of the Canadian dollar to
US dollar exchange rate which we expect to moderate in the back half of the year. For the full-year 2016, we now expect
CASM, excluding fuel and employee profit share, to be flat to up 2.0 per cent year over year. This compares with our previous
full-year 2016 guidance of down 0.5 to up 1.5 per cent year over year, with the difference primarily driven by the continued
weakening of the Canadian dollar to US dollar exchange rate.
For the first quarter of 2016, we expect fuel costs to range between 47 and 49 cents per litre, which represents a year-over-
year decrease of approximately 25 to 28 per cent. The first quarter 2016 expected fuel costs are based on current forecasted
jet fuel prices of US $40 per barrel and an average forecasted foreign exchange rate of approximately 1.41 Canadian dollars
to one US dollar.
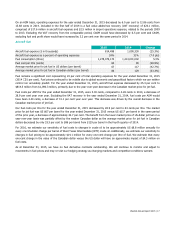
For the full-year 2016, we continue to forecast capital expenditures between $830 million and $850 million, with spending
related primarily to aircraft deliveries, deposits on future aircraft, overhauls on owned engines and the installation of a new
inflight entertainment system on certain aircraft. For the first quarter of 2016, we expect our capital expenditures to be
between $240 million and $250 million.
The first quarter and full-year 2016 expected CASM, excluding fuel and employee profit share and capital expenditures are
based on an average forecasted foreign exchange rate of approximately 1.41 Canadian dollars to one US dollar.
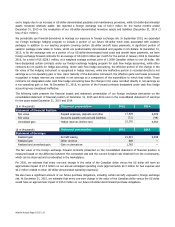
Guidance summary
Three months ended
March 31, 2016
Year ended
December 31, 2016
Guidance summary
RASM Down 10.0% to 12.0%
Fuel cost per litre 47 to 49 cents
CASM, excluding fuel and profit share Up 7.5% to 8.0% Flat to up 2.0%
System capacity Up 6.0% to 6.5% Up 7.0% to 10.0%
Domestic capacity Up 10.0% to 10.5% Up 3.0% to 4.0%
Effective tax rate 28% to 30%
Capital expenditures $240 to $250 million $830 to $850 million