Westjet 2015 Annual Report Download - page 57
Download and view the complete annual report
Please find page 57 of the 2015 Westjet annual report below. You can navigate through the pages in the report by either clicking on the pages listed below, or by using the keyword search tool below to find specific information within the annual report.-
 1
1 -
2
-
3
-
4
-
5
-
6
-
7
-
8
-
9
-
10
-
11
-
12
-
13
-
14
-
15
-
16
-
17
-
18
-
19
-
20
-
21
-
22
-
23
-
24
-
25
-
26
-
27
-
28
-
29
-
30
-
31
-
32
-
33
-
34
-
35
-
36
-
37
-
38
-
39
-
40
-
41
-
42
-
43
-
44
-
45
-
46
-
 47
47 -
 48
48 -
 49
49 -
 50
50 -
 51
51 -
 52
52 -
 53
53 -
 54
54 -
 55
55 -
 56
56 -
 57
57 -
 58
58 -
 59
59 -
 60
60 -
 61
61 -
 62
62 -
 63
63 -
 64
64 -
 65
65 -
 66
66 -
 67
67 -
68
-
69
-
70
-
71
-
72
-
73
-
74
-
75
-
76
-
77
-
78
-
79
-
80
-
81
-
82
-
83
-
84
-
85
-
86
-
87
-
88
-
89
-
90
-
91
-
92
-
93
-
94
-
95
-
96
-
97
-
98
-
99
-
100
-
101
 |
 |

WestJet Annual Report 2015 | 55
good standing, and that our aircraft delivery schedule
will proceed as expected;
• That the future outcome of our current legal
proceedings and claims will not have a material effect
upon our financial position, results of operations or cash
flows is based on a review of current legal proceedings
by management and legal counsel and our assumption
that such proceedings and claims will be resolved in a
manner consistent with such assessment;
• Our expectations with respect to future aircraft
acquisitions and dispositions are based on the terms of
the applicable agreements.
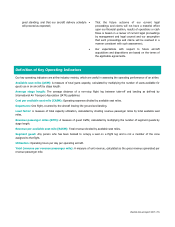
Definition of Key Operating Indicators
Our key operating indicators are airline industry metrics, which are useful in assessing the operating performance of an airline.
Available seat miles (ASM): A measure of total guest capacity, calculated by multiplying the number of seats available for
guest use in an aircraft by stage length.
Average stage length: The average distance of a non-stop flight leg between take-off and landing as defined by
International Air Transport Association (IATA) guidelines.
Cost per available seat mile (CASM): Operating expenses divided by available seat miles.
Departures: One flight, counted by the aircraft leaving the ground and landing.
Load factor: A measure of total capacity utilization, calculated by dividing revenue passenger miles by total available seat
miles.
Revenue passenger miles (RPM): A measure of guest traffic, calculated by multiplying the number of segment guests by
stage length.
Revenue per available seat mile (RASM): Total revenue divided by available seat miles.
Segment guest: Any person who has been booked to occupy a seat on a flight leg and is not a member of the crew
assigned to the flight.
Utilization: Operating hours per day per operating aircraft.
Yield (revenue per revenue passenger mile): A measure of unit revenue, calculated as the gross revenue generated per
revenue passenger mile.