Westjet 2015 Annual Report Download - page 25
Download and view the complete annual report
Please find page 25 of the 2015 Westjet annual report below. You can navigate through the pages in the report by either clicking on the pages listed below, or by using the keyword search tool below to find specific information within the annual report.-
 1
1 -
2
-
3
-
4
-
5
-
6
-
7
-
8
-
9
-
10
-
11
-
12
-
13
-
14
-
 15
15 -
 16
16 -
 17
17 -
 18
18 -
 19
19 -
 20
20 -
 21
21 -
 22
22 -
 23
23 -
 24
24 -
 25
25 -
 26
26 -
 27
27 -
 28
28 -
 29
29 -
 30
30 -
 31
31 -
 32
32 -
 33
33 -
 34
34 -
 35
35 -
36
-
37
-
38
-
39
-
40
-
41
-
42
-
43
-
44
-
45
-
46
-
47
-
48
-
49
-
50
-
51
-
52
-
53
-
54
-
55
-
56
-
57
-
58
-
59
-
60
-
61
-
62
-
63
-
64
-
65
-
66
-
67
-
68
-
69
-
70
-
71
-
72
-
73
-
74
-
75
-
76
-
77
-
78
-
79
-
80
-
81
-
82
-
83
-
84
-
85
-
86
-
87
-
88
-
89
-
90
-
91
-
92
-
93
-
94
-
95
-
96
-
97
-
98
-
99
-
100
-
101
 |
 |

WestJet Annual Report 2015 | 23
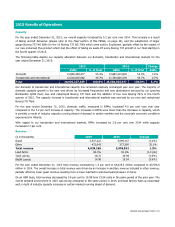
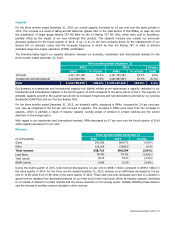
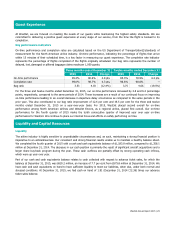
Capacity
For the three months ended December 31, 2015, our overall capacity increased by 2.3 per cent over the same periods in
2014. This increase is a result of taking aircraft deliveries (please refer to the
Fleet
section of this MD&A, on page 34) and
the substitution of larger gauge Boeing 737 NG 800s for the 10 Boeing 737 NG 700s, which were sold to Southwest,
partially offset by the impact of our new enhanced Plus product. This capacity increase was outside our previously
disclosed guidance for the fourth quarter of 2015, of up 1.5 to 2.0 per cent, primarily driven by the redeployment of our
Boeing 767 on domestic routes and the increased frequency in which we flew the Boeing 767, in order to achieve
extended-range twin-engine operations (ETOP) certification.
The following tables depict our capacity allocation between our domestic, transborder and international markets for the
three months ended December 31, 2015:
Three months ended December 31
2015 2014 Change
ASMs
% of total
ASMs
% of total
ASMs
Domestic 3,421,179,189 52.4% 3,141,759,184 49.3% 8.9%
Transborder and international
3,103,609,786
47.6%
3,236,487,834
50.7%
(4.1%)
Total 6,524,788,975 100.0% 6,378,247,018 100.0% 2.3%
Our domestic to transborder and international capacity mix slightly shifted as we experienced a capacity reduction in our
transborder and international markets in the fourth quarter of 2015 compared to the same period of 2014. The majority of
domestic capacity growth in the quarter was driven by increased frequencies and new destinations serviced by our growing
Bombardier Q400 fleet and our first two Boeing 767s.
For the three months ended December 31, 2015, our domestic traffic, measured in RPMs, increased by 2.0 per cent year
over year as compared to the 8.9 per cent increase in capacity. The increases in RPMs were lower than the increases in
capacity, which is partially a result of industry capacity running ahead of demand in certain markets and the severe
downturn in the energy sector.
With regard to our transborder and international markets, RPMs decreased by 0.7 per cent over the fourth quarter of 2014
while capacity decreased 4.1 per cent.
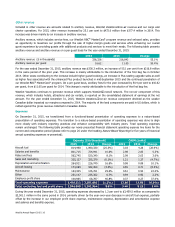
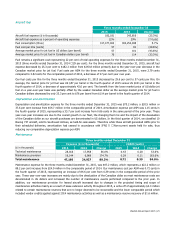
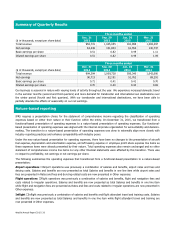
Revenue
Three months ended December 31
($ in thousands)
2015
2014
Change
Guest
842,546
884,771
(4.8%)
Other 116,169
109,623
6.0%
Total revenue 958,715
994,394
(3.6%)
Load factor
78.4%
79.7%
(1.3pts.)
Yield (cents)
18.75
19.57
(4.2%)
RASM (cents) 14.69
15.59
(5.8%)
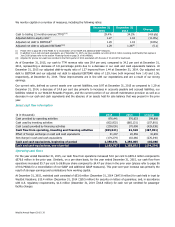
During the fourth quarter of 2015, total revenue decreased by 3.6 per cent to $958.7 million compared to $994.4 million in
the same quarter of 2014. For the three months ended December 31, 2015, revenue on an ASM basis decreased by 5.8 per
cent to 14.69 cents from 15.59 cents in the same quarter of 2014. These year-over-year decreases were due to a decline in
guest revenue resulting from downward pressure on our fares and a lower load factor driven by industry capacity continuing
to run ahead of demand in certain markets and the severe downturn in the energy sector. Partially offsetting these declines
was the increase in ancillary revenue included in other revenue.