Westjet 2015 Annual Report Download - page 12
Download and view the complete annual report
Please find page 12 of the 2015 Westjet annual report below. You can navigate through the pages in the report by either clicking on the pages listed below, or by using the keyword search tool below to find specific information within the annual report.-
 1
1 -
 2
2 -
 3
3 -
 4
4 -
 5
5 -
 6
6 -
 7
7 -
 8
8 -
 9
9 -
 10
10 -
 11
11 -
 12
12 -
 13
13 -
 14
14 -
 15
15 -
 16
16 -
 17
17 -
 18
18 -
 19
19 -
 20
20 -
 21
21 -
 22
22 -
23
-
24
-
25
-
26
-
27
-
28
-
29
-
30
-
31
-
32
-
33
-
34
-
35
-
36
-
37
-
38
-
39
-
40
-
41
-
42
-
43
-
44
-
45
-
46
-
47
-
48
-
49
-
50
-
51
-
52
-
53
-
54
-
55
-
56
-
57
-
58
-
59
-
60
-
61
-
62
-
63
-
64
-
65
-
66
-
67
-
68
-
69
-
70
-
71
-
72
-
73
-
74
-
75
-
76
-
77
-
78
-
79
-
80
-
81
-
82
-
83
-
84
-
85
-
86
-
87
-
88
-
89
-
90
-
91
-
92
-
93
-
94
-
95
-
96
-
97
-
98
-
99
-
100
-
101
 |
 |

WestJet Annual Report 2015 | 10
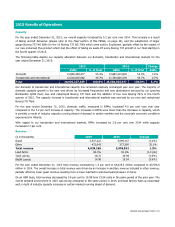
Annual Overview
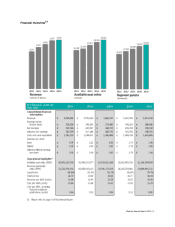
Our 2015 financial results represent our 11th consecutive year of reported profitability with net earnings of $367.5 million and
a record annual diluted earnings per share of $2.92. During the year, our operating margin was 14.1 per cent, driven largely
by continued lower fuel prices and an increase in ancillary revenue. Total revenue increased by 1.3 per cent year over year,
driven by the increase in ancillary revenue which was offset by lower guest revenue resulting from downward pressure on our
fares and a lower load factor.
We returned approximately $193.5 million to our shareholders through our dividend and share buy-back programs in 2015.
Since these programs began in 2010, we have returned over seven hundred million dollars to our shareholders. At December
31, 2015, our annual ROIC was 15.3 per cent, which represents an increase of 1.0 percentage point compared to our 2014
annual ROIC of 14.3 per cent. This result is consistent with our ROIC targeted range of 13.0 to 16.0 per cent.
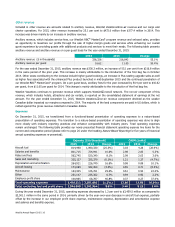
2015 Summary
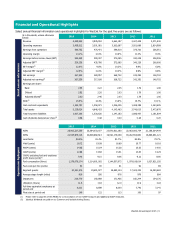
• Recognized total revenue of $4,029.3 million, an increase of 1.3 per cent from $3,976.6 million in 2014.
• Increased capacity, measured in available seat miles (ASMs), by 5.2 per cent over 2014.
• Increased traffic, measured in revenue passenger miles (RPMs), by 3.3 per cent over 2014.
• Realized yield of 18.72 cents, down 1.9 per cent from 2014.
• Realized RASM of 14.98 cents, down 3.6 per cent from 15.54 cents in 2014.
• Realized CASM of 12.86 cents, down 6.0 per cent from 13.68 cents in 2014.
• Realized CASM, excluding fuel and employee profit share, of 9.46 cents, up 3.4 per cent from 9.15 cents in 2014.
• Recorded an operating margin of 14.1 per cent, up 2.1 percentage points from 12.0 per cent in 2014.
• Recorded EBT margin of 12.9 per cent, up 3.1 percentage points from 9.8 per cent in 2014. Adjusted for the pre-tax
non-cash loss recorded in 2014, EBT margin was up 1.9 percentage points.
• Reported net earnings of $367.5 million, an increase of 29.4 per cent from $284.0 million in 2014. Adjusted for the
after-tax non-cash loss recorded in 2014, net earnings increased 15.9 per cent.
• Reported diluted earnings per share of $2.92, an increase of 32.7 per cent from $2.20 per share in 2014. Adjusted
for the after-tax non-cash loss recorded in 2014, diluted earnings per share increased 18.7 per cent.
Please refer to page 56 of this MD&A for a reconciliation of non-GAAP measures and additional GAAP measures.