Westjet 2015 Annual Report Download - page 17
Download and view the complete annual report
Please find page 17 of the 2015 Westjet annual report below. You can navigate through the pages in the report by either clicking on the pages listed below, or by using the keyword search tool below to find specific information within the annual report.-
 1
1 -
2
-
3
-
4
-
5
-
6
-
 7
7 -
 8
8 -
 9
9 -
 10
10 -
 11
11 -
 12
12 -
 13
13 -
 14
14 -
 15
15 -
 16
16 -
 17
17 -
 18
18 -
 19
19 -
 20
20 -
 21
21 -
 22
22 -
 23
23 -
 24
24 -
 25
25 -
 26
26 -
 27
27 -
28
-
29
-
30
-
31
-
32
-
33
-
34
-
35
-
36
-
37
-
38
-
39
-
40
-
41
-
42
-
43
-
44
-
45
-
46
-
47
-
48
-
49
-
50
-
51
-
52
-
53
-
54
-
55
-
56
-
57
-
58
-
59
-
60
-
61
-
62
-
63
-
64
-
65
-
66
-
67
-
68
-
69
-
70
-
71
-
72
-
73
-
74
-
75
-
76
-
77
-
78
-
79
-
80
-
81
-
82
-
83
-
84
-
85
-
86
-
87
-
88
-
89
-
90
-
91
-
92
-
93
-
94
-
95
-
96
-
97
-
98
-
99
-
100
-
101
 |
 |

WestJet Annual Report 2015 | 15
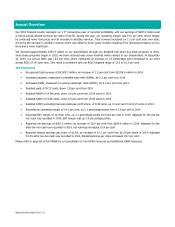
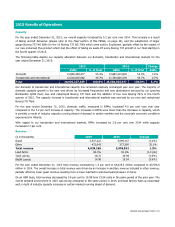
2015 Results of Operations
Capacity
For the year ended December 31, 2015, our overall capacity increased by 5.2 per cent over 2014. This increase is a result
of taking aircraft deliveries (please refer to the
Fleet
section of this MD&A, on page 34), and the substitution of larger
gauge Boeing 737 NG 800s for the 10 Boeing 737 NG 700s which were sold to Southwest, partially offset by the impact of
our new enhanced Plus product which had the effect of taking six seats off every Boeing 737 aircraft in our fleet starting in
the fourth quarter of 2015.
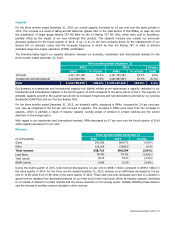
The following table depicts our capacity allocation between our domestic, transborder and international markets for the
year ended December 31, 2015:
2015
2014
Change
ASMs % of total ASMs % of total ASMs
Domestic
14,883,384,477
55.3%
13,883,212,833
54.3%
7.2%
Transborder and international 12,018,842,882 44.7% 11,700,820,244 45.7% 2.7%
Total 26,902,227,359 100.0% 25,584,033,077 100.0% 5.2%
Our domestic to transborder and international capacity mix remained relatively unchanged year over year. The majority of
domestic capacity growth in the year was driven by increased frequencies and new destinations serviced by our growing
Bombardier Q400 fleet, new and redeployed Boeing 737 fleet and the addition of two new Boeing 767s in the fourth
quarter of 2015. The capacity increase in transborder and international markets was serviced by our new and redeployed
Boeing 737 fleet.
For the year ended December 31, 2015, domestic traffic, measured in RPMs, increased 4.0 per cent year over year
compared to the 7.2 per cent increase in capacity. The increases in RPMs were lower than the increases in capacity, which
is partially a result of industry capacity running ahead of demand in certain markets and the uncertain economic conditions
experienced in Alberta.
With regard to our transborder and international markets, RPMs increased by 2.6 per cent over 2014 while capacity
increased 2.7 per cent.
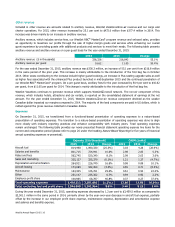
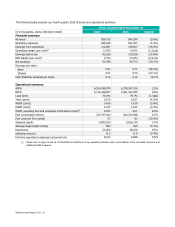
Revenue
($ in thousands)
2015
2014
Change
Guest 3,557,222
3,599,157
(1.2%)
Other 472,043
377,395
25.1%
Total revenue 4,029,265
3,976,552
1.3%
Load factor
80.0%
81.4%
(1.4 pts)
Yield (cents)
18.72
19.09
(1.9%)
RASM (cents)
14.98
15.54
(3.6%)
For the year ended December 31, 2015 total revenue increased by 1.3 per cent to $4,029.3 million compared to $3,976.6
million in 2014. The overall increase in total revenue was driven by an increase in ancillary revenue included in other revenue,
partially offset by lower guest revenue resulting from a lower load factor and downward pressure on fares.
On an ASM basis, total revenue decreased by 3.6 per cent to 14.98 from 15.54 cents in the same period of the prior year. The
overall demand environment in 2015 was strong compared to the same period in 2014, and load factors held up reasonably
well, in light of industry capacity increases in certain markets running ahead of demand.