WeightWatchers 2004 Annual Report Download - page 94
Download and view the complete annual report
Please find page 94 of the 2004 WeightWatchers annual report below. You can navigate through the pages in the report by either clicking on the pages listed below, or by using the keyword search tool below to find specific information within the annual report.-
 1
1 -
2
-
3
-
4
-
5
-
6
-
7
-
8
-
9
-
10
-
11
-
12
-
13
-
14
-
15
-
16
-
17
-
18
-
19
-
20
-
21
-
22
-
23
-
24
-
25
-
26
-
27
-
28
-
29
-
30
-
31
-
32
-
33
-
34
-
35
-
36
-
37
-
38
-
39
-
40
-
41
-
42
-
43
-
44
-
45
-
46
-
47
-
48
-
49
-
50
-
51
-
52
-
53
-
54
-
55
-
56
-
57
-
58
-
59
-
60
-
61
-
62
-
63
-
64
-
65
-
66
-
67
-
68
-
69
-
70
-
71
-
72
-
73
-
74
-
75
-
76
-
77
-
78
-
79
-
80
-
81
-
82
-
83
-
 84
84 -
 85
85 -
 86
86 -
 87
87 -
 88
88 -
 89
89 -
 90
90 -
 91
91 -
 92
92 -
 93
93 -
 94
94 -
 95
95 -
 96
96 -
 97
97 -
 98
98 -
 99
99 -
 100
100 -
 101
101 -
 102
102 -
 103
103 -
 104
104 -
105
-
106
-
107
-
108
-
109
-
110
-
111
-
112
-
113
-
114
-
115
-
116
 |
 |

WEIGHT WATCHERS INTERNATIONAL, INC. AND SUBSIDIARIES
NOTES TO CONSOLIDATED FINANCIAL STATEMENTS (Continued)
(IN THOUSANDS, EXCEPT PER SHARE AMOUNTS)
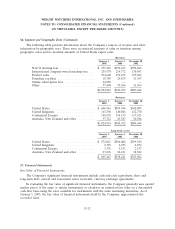
16. Segment and Geographic Data (Continued)
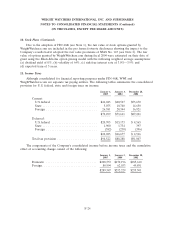
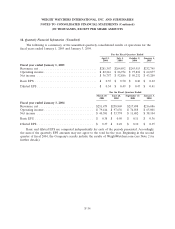
The following table presents information about the Company’s sources of revenue and other
information by geographic area. There were no material amounts of sales or transfers among
geographic areas and no material amounts of United States export sales.
Revenues
January 1, January 3, December 28,
2005 2004 2002
NACO meeting fees .................... $ 373,119 $392,432 $350,683
International company-owned meeting fees . . . 255,978 214,772 170,043
Product sales ......................... 274,640 276,835 237,602
Franchise royalties ..................... 18,789 24,879 31,347
Online subscription fees ................. 64,989 — —
Other ............................... 37,404 35,014 19,969
$1,024,919 $943,932 $809,644
Revenues
January 1, January 3, December 28,
2005 2004 2002
United States ......................... $ 606,916 $599,944 $542,885
United Kingdom ....................... 163,338 140,886 112,750
Continental Europe .................... 196,953 159,155 117,425
Australia, New Zealand and other .......... 57,712 43,947 36,584
$1,024,919 $943,932 $809,644
Long-Lived Assets
January 1, January 3, December 28,
2005 2004 2002
United States ......................... $ 572,012 $506,004 $299,349
United Kingdom ....................... 2,383 2,653 2,854
Continental Europe .................... 3,376 3,153 2,537
Australia, New Zealand and other .......... 27,676 26,431 18,302
$ 605,447 $538,241 $323,042
17. Financial Instruments
Fair Value of Financial Instruments:
The Company’s significant financial instruments include cash and cash equivalents, short and
long-term debt, current and noncurrent notes receivable, currency exchange agreements.
In evaluating the fair value of significant financial instruments, the Company generally uses quoted
market prices of the same or similar instruments or calculates an estimated fair value on a discounted
cash flow basis using the rates available for instruments with the same remaining maturities. As of
January 1, 2005, the fair value of financial instruments held by the Company, approximated the
recorded value.
F-32