WeightWatchers 2004 Annual Report Download - page 29
Download and view the complete annual report
Please find page 29 of the 2004 WeightWatchers annual report below. You can navigate through the pages in the report by either clicking on the pages listed below, or by using the keyword search tool below to find specific information within the annual report.-
 1
1 -
2
-
3
-
4
-
5
-
6
-
7
-
8
-
9
-
10
-
11
-
12
-
13
-
14
-
15
-
16
-
17
-
18
-
 19
19 -
 20
20 -
 21
21 -
 22
22 -
 23
23 -
 24
24 -
 25
25 -
 26
26 -
 27
27 -
 28
28 -
 29
29 -
 30
30 -
 31
31 -
 32
32 -
 33
33 -
 34
34 -
 35
35 -
 36
36 -
 37
37 -
 38
38 -
 39
39 -
40
-
41
-
42
-
43
-
44
-
45
-
46
-
47
-
48
-
49
-
50
-
51
-
52
-
53
-
54
-
55
-
56
-
57
-
58
-
59
-
60
-
61
-
62
-
63
-
64
-
65
-
66
-
67
-
68
-
69
-
70
-
71
-
72
-
73
-
74
-
75
-
76
-
77
-
78
-
79
-
80
-
81
-
82
-
83
-
84
-
85
-
86
-
87
-
88
-
89
-
90
-
91
-
92
-
93
-
94
-
95
-
96
-
97
-
98
-
99
-
100
-
101
-
102
-
103
-
104
-
105
-
106
-
107
-
108
-
109
-
110
-
111
-
112
-
113
-
114
-
115
-
116
 |
 |

In accordance with the provisions of FIN 46R, we recorded a charge of $11.9 million, including
taxes, in the first quarter of 2004. This charge reflects the cumulative impact to our results of
operations had WeightWatchers.com been consolidated since its inception in September 1999.
For the year ended January 1, 2005, the consolidation combined with the first quarter cumulative
effect of accounting change, including taxes, related to the adoption of FIN 46R, resulted in an
increase to diluted earnings per share of $0.03.
Weight Watchers International (excluding the impact of FIN 46R)
The remaining sections of this discussion will address only the results of Weight Watchers
International and its majority-owned subsidiaries and will exclude the impact of FIN 46R and the
consolidation of WeightWatchers.com.
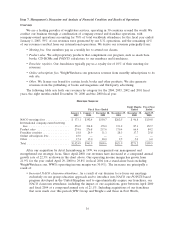
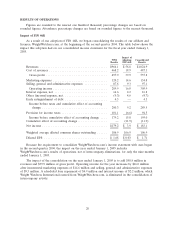
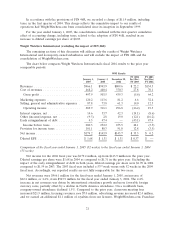
The chart below compares Weight Watchers International’s fiscal 2004 results to the prior year
comparable periods:
WWI Results
FY 2004 FY 2003
January 1, January 3, December 28, Inc/(Dec) Inc/(Dec)
2005 2004 2002 FY 2003 FY 2002
Revenues .......................... $966.1 $943.9 $809.6 $ 22.2 $134.3
Cost of revenues ..................... 468.2 440.4 370.3 27.8 70.1
Gross profit ....................... 497.9 503.5 439.3 (5.6) 64.2
Marketing expenses ................... 120.2 113.6 81.2 6.6 32.4
Selling, general and administrative expenses . 87.8 73.8 61.3 14.0 12.5
Operating income .................. 289.9 316.1 296.8 (26.2) 19.3
Interest expense, net .................. 14.6 33.7 42.3 (19.1) (8.6)
Other (income)/expense, net ............ (9.3) 2.8 19.0 (12.1) (16.2)
Early extinguishment of debt ............ 4.3 47.4 — (43.1) 47.4
Income before taxes ................. 280.3 232.2 235.5 48.1 (3.3)
Provision for income taxes .............. 101.1 88.3 91.8 12.8 (3.5)
Net income ......................... $179.2 $143.9 $143.7 $ 35.3 $ 0.2
Diluted EPS ........................ $ 1.68 $ 1.31 $ 1.31 $ 0.37 $ —
Comparison of the fiscal year ended January 1, 2005 (52 weeks) to the fiscal year ended January 3, 2004
(53 weeks)
Net income for the 2004 fiscal year was $179.2 million, up from $143.9 million in the prior year.
Diluted earnings per share were $1.68 in 2004 as compared to $1.31 in the prior year. Excluding the
impact of the early extinguishment of debt in both years, diluted earnings per share were $1.70 in 2004
compared to $1.59 in 2003. The 2003 fiscal year included a 53rd week versus only 52 weeks in the 2004
fiscal year. Accordingly, our reported results are not fully comparable for the two years.
Net revenues were $966.1 million for the fiscal year ended January 1, 2005, an increase of
$22.2 million, or 2.4%, from $943.9 million for the fiscal year ended January 3, 2004. The 2.4%
increase in net revenues was driven by international attendance growth and more favorable foreign
currency rates, partially offset by a decline in North America attendance. On a worldwide basis,
company-owned attendance declined 1.5%. Compared to the prior year, classroom meeting fees
increased $21.9 million, licensing revenues rose $7.0 million, advertising revenue increased $2.4 million,
and we earned an additional $1.1 million of royalties from our licensee, WeightWatchers.com. Franchise
21