WeightWatchers 2004 Annual Report Download - page 25
Download and view the complete annual report
Please find page 25 of the 2004 WeightWatchers annual report below. You can navigate through the pages in the report by either clicking on the pages listed below, or by using the keyword search tool below to find specific information within the annual report.-
 1
1 -
2
-
3
-
4
-
5
-
6
-
7
-
8
-
9
-
10
-
11
-
12
-
13
-
14
-
 15
15 -
 16
16 -
 17
17 -
 18
18 -
 19
19 -
 20
20 -
 21
21 -
 22
22 -
 23
23 -
 24
24 -
 25
25 -
 26
26 -
 27
27 -
 28
28 -
 29
29 -
 30
30 -
 31
31 -
 32
32 -
 33
33 -
 34
34 -
 35
35 -
36
-
37
-
38
-
39
-
40
-
41
-
42
-
43
-
44
-
45
-
46
-
47
-
48
-
49
-
50
-
51
-
52
-
53
-
54
-
55
-
56
-
57
-
58
-
59
-
60
-
61
-
62
-
63
-
64
-
65
-
66
-
67
-
68
-
69
-
70
-
71
-
72
-
73
-
74
-
75
-
76
-
77
-
78
-
79
-
80
-
81
-
82
-
83
-
84
-
85
-
86
-
87
-
88
-
89
-
90
-
91
-
92
-
93
-
94
-
95
-
96
-
97
-
98
-
99
-
100
-
101
-
102
-
103
-
104
-
105
-
106
-
107
-
108
-
109
-
110
-
111
-
112
-
113
-
114
-
115
-
116
 |
 |

Washington, D.C., Dallas, New Mexico, North Jersey, San Diego and Eastern North Carolina),
our attendance grew from 13.3 million in April 2000 to 32.3 million in 2004.
•Accelerated growth in Continental Europe. In Continental Europe, we have accelerated growth by
adapting our business model to local conditions, implementing more aggressive marketing
programs tailored to the local markets and increasing the number of meetings ahead of
anticipated demand. Between April 2000 and fiscal 2004, attendance in our Continental
European operations grew at a compound annual rate of 13.9%.
•Increased product sales. We have increased our product sales by 226% from April 2000 to fiscal
2004 as a result of our growing attendance and introducing new products. In our meetings, we
have increased average product sales per attendance from $2.03 to $3.69 over the same period.
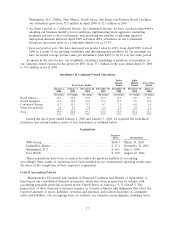
As shown in the chart below, our worldwide attendance (including acquisitions of franchises) in
our company-owned operations has grown by 80%, from 33.3 million in the year ended April 29, 2000
to 59.9 million in fiscal 2004.
Attendance in Company-Owned Operations
Twelve Eight
Months Months Fiscal Year
Fiscal Years Ended Ended Ended Ended
January 1, January 3, December 28, December 29, December 30, December 30, April 29,
2005 2004 2002 2001 2000 2000 2000
(52 weeks) (53 weeks) (52 weeks) (52 weeks) (54 weeks) (35 weeks) (53 weeks)
North America ........ 32.3 34.6 30.8 23.5 14.3 8.9 13.3
United Kingdom ....... 13.0 12.8 11.9 11.6 11.2 7.0 10.6
Continental Europe .... 11.2 10.1 9.2 8.7 7.0 4.6 6.1
Other International ..... 3.4 3.3 3.4 3.2 3.2 1.9 3.3
Total ............... 59.9 60.8 55.3 47.0 35.7 22.4 33.3
During the fiscal years ended January 1, 2005 and January 3, 2004, we acquired the franchised
territories and certain business assets of four franchisees as outlined below:
Acquisitions
Purchase
Price Closing Date
WW Group ..................................... $180.7 March 30, 2003
Dallas/New Mexico ................................ $ 27.2 November 30, 2003
Washington, D.C. ................................. $ 30.5 May 9, 2004
Fort Worth ...................................... $ 30.0 August 22, 2004
These acquisitions have been accounted for under the purchase method of accounting.
Accordingly, their results of operations have been included in our consolidated operating results since
the dates of the completion of their respective acquisitions.
Critical Accounting Policies
‘‘Management’s Discussion and Analysis of Financial Condition and Results of Operations’’ is
based upon our consolidated financial statements, which have been prepared in accordance with
accounting principles generally accepted in the United States of America (‘‘U.S. GAAP’’). The
preparation of these financial statements requires us to make estimates and judgments that affect the
reported amounts of assets, liabilities, revenues and expenses, and related disclosure of contingent
assets and liabilities. On an ongoing basis, we evaluate our estimates and judgments, including those
17