Walgreens 2014 Annual Report Download - page 98
Download and view the complete annual report
Please find page 98 of the 2014 Walgreens annual report below. You can navigate through the pages in the report by either clicking on the pages listed below, or by using the keyword search tool below to find specific information within the annual report.-
 1
1 -
2
-
3
-
4
-
5
-
6
-
7
-
8
-
9
-
10
-
11
-
12
-
13
-
14
-
15
-
16
-
17
-
18
-
19
-
20
-
21
-
22
-
23
-
24
-
25
-
26
-
27
-
28
-
29
-
30
-
31
-
32
-
33
-
34
-
35
-
36
-
37
-
38
-
39
-
40
-
41
-
42
-
43
-
44
-
45
-
46
-
47
-
48
-
49
-
50
-
51
-
52
-
53
-
54
-
55
-
56
-
57
-
58
-
59
-
60
-
61
-
62
-
63
-
64
-
65
-
66
-
67
-
68
-
69
-
70
-
71
-
72
-
73
-
74
-
75
-
76
-
77
-
78
-
79
-
80
-
81
-
82
-
83
-
84
-
85
-
86
-
87
-
 88
88 -
 89
89 -
 90
90 -
 91
91 -
 92
92 -
 93
93 -
 94
94 -
 95
95 -
 96
96 -
 97
97 -
 98
98 -
 99
99 -
 100
100 -
 101
101 -
 102
102 -
 103
103 -
 104
104 -
 105
105 -
 106
106 -
 107
107 -
 108
108 -
109
-
110
-
111
-
112
-
113
-
114
-
115
-
116
-
117
-
118
-
119
-
120
 |
 |

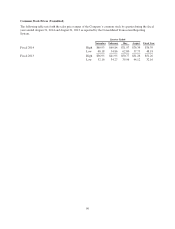
Common Stock Prices (Unaudited)
The following table sets forth the sales price ranges of the Company’s common stock by quarter during the fiscal
years ended August 31, 2014 and August 31, 2013 as reported by the Consolidated Transaction Reporting
System.
Quarter Ended
November February May August Fiscal Year
Fiscal 2014 High $60.93 $69.84 $71.97 $76.39 $76.39
Low 48.18 54.86 62.80 57.75 48.18
Fiscal 2013 High $36.95 $41.95 $50.77 $51.26 $51.26
Low 32.16 34.27 39.96 44.12 32.16
90