Walgreens 2014 Annual Report Download - page 52
Download and view the complete annual report
Please find page 52 of the 2014 Walgreens annual report below. You can navigate through the pages in the report by either clicking on the pages listed below, or by using the keyword search tool below to find specific information within the annual report.-
 1
1 -
2
-
3
-
4
-
5
-
6
-
7
-
8
-
9
-
10
-
11
-
12
-
13
-
14
-
15
-
16
-
17
-
18
-
19
-
20
-
21
-
22
-
23
-
24
-
25
-
26
-
27
-
28
-
29
-
30
-
31
-
32
-
33
-
34
-
35
-
36
-
37
-
38
-
39
-
40
-
41
-
 42
42 -
 43
43 -
 44
44 -
 45
45 -
 46
46 -
 47
47 -
 48
48 -
 49
49 -
 50
50 -
 51
51 -
 52
52 -
 53
53 -
 54
54 -
 55
55 -
 56
56 -
 57
57 -
 58
58 -
 59
59 -
 60
60 -
 61
61 -
 62
62 -
63
-
64
-
65
-
66
-
67
-
68
-
69
-
70
-
71
-
72
-
73
-
74
-
75
-
76
-
77
-
78
-
79
-
80
-
81
-
82
-
83
-
84
-
85
-
86
-
87
-
88
-
89
-
90
-
91
-
92
-
93
-
94
-
95
-
96
-
97
-
98
-
99
-
100
-
101
-
102
-
103
-
104
-
105
-
106
-
107
-
108
-
109
-
110
-
111
-
112
-
113
-
114
-
115
-
116
-
117
-
118
-
119
-
120
 |
 |
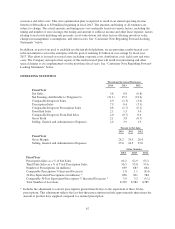
foods, photofinishing products and personal care. Front-end sales were 35.8% of total sales in fiscal 2014, 37.1%
of total sales in fiscal 2013 and 36.8% of total sales in fiscal 2012. Comparable drugstore front-end sales
increased 2.0% in 2014 compared to a decrease of 0.7% in 2013 and an increase of 0.6% in 2012. The increase in
fiscal 2014 comparable front-end sales was primarily attributable to an increase in basket size partially offset by
lower customer traffic.
Gross margin as a percent of sales was 28.2% in 2014, compared to 29.3% in fiscal 2013. Gross margin in fiscal
2014 was negatively impacted by lower retail pharmacy margins primarily from lower third-party
reimbursement; the increase in Medicare Part D mix and the strategy to continue driving 90-day prescriptions at
retail; fewer brand-to-generic drug conversions compared with the prior year period; generic drug inflation on a
subset of generic drugs; and the mix of specialty drugs, which carry a lower margin percentage. Front-end
margins were negatively impacted in the photofinishing, non-prescription drug and convenience and fresh foods
categories. Pharmacy and front-end margin decreases were partially offset by purchasing synergies realized from
the joint venture formed by Walgreens and Alliance Boots and a lower provision for LIFO in fiscal 2014. Gross
margin as a percent of sales was 29.3% in fiscal 2013 and 28.4% in fiscal 2012. Gross margin in fiscal 2013 was
positively impacted by higher retail pharmacy margins, where the impact of new generics more than offset lower
market driven reimbursements, improved front-end margins primarily from the non-prescription drug, personal
care and beauty care categories and a lower LIFO provision compared to fiscal 2012.
Gross profit dollars in fiscal 2014 increased 2.1% over the prior year. The increase is primarily attributed to
increased sales and a lower LIFO provision which was partially offset by lower retail pharmacy margins. Gross
profit dollars in fiscal 2013 increased 3.8% over fiscal 2012, primarily attributed to higher retail pharmacy margins.
We use the last-in, first-out (LIFO) method of inventory valuation. The LIFO provision is dependent upon
inventory levels, inflation rates and merchandise mix. The effective LIFO inflation rates were 1.5% in 2014,
2.7% in 2013 and 3.3% in 2012, which resulted in charges to cost of sales of $132 million in 2014, $239 million
in 2013 and $309 million in 2012. Inflation on prescription inventory was 14.0% in 2014, 10.7% in 2013 and
10.0% in 2012. As a result of declining inventory levels, the fiscal 2014, 2013 and 2012 LIFO provisions were
reduced by LIFO liquidations of $187 million and $194 million and $268 million, respectively.
Selling, general and administrative expenses were 23.6% of sales in fiscal 2014, compared to 24.3% of sales in
fiscal 2013. As a percentage of sales, expenses were lower primarily due to lower store compensation costs, store
occupancy costs and headquarters costs, partially offset by costs related to our store optimization plan. Selling,
general and administrative expenses as a percentage of sales increased to 24.3% in 2013 as compared to 23.6% in
2012. The increase was primarily due to higher occupancy expense, investments in strategic initiatives and
capabilities and store salaries attributable to new store growth, which were partially offset by lower expenses
associated with our investment in Alliance Boots as compared to 2012.
Selling, general and administrative expense dollars increased $449 million, or 2.6% over fiscal 2013. The growth is
attributable to 1.5% of store closure and other optimization costs, 1.3% of new store expenses, and 0.5% of
comparable store and headquarter expenses. These increases were partially offset by a reduction in acquisition
related costs and acquisition-related amortization, each of which were lower by 0.1%. In addition, certain
nonrecurring costs were incurred in the prior year, each of which contributed to a lower growth rate in the current
year including Hurricane Sandy of 0.2%, legal costs related to the DEA settlement last year of 0.2% and costs
related to the completion of a pharmaceutical distribution contract of 0.1%. Selling, general and administrative
expense dollars in fiscal 2013 increased 3.9% over fiscal 2012. The increase was attributable to new store expenses
of 2.4%, 0.5% from USA Drug operations, 0.2% of comparable store and headquarter expenses, 0.2% from
Hurricane Sandy, 0.2% in acquisition-related amortization, 0.2% in costs related to the DEA settlement, 0.1% from
acquisition-related costs and 0.1% in costs related to the completion of a pharmaceutical distribution contract.
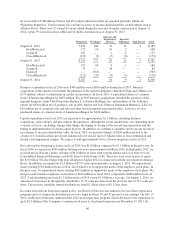
Earnings in the 45% Alliance Boots equity method investment for fiscal 2014 were $617 million compared to
$344 million last year. Alliance Boots earnings are reported on a three-month lag. The twelve month period
ended August 31, 2013 only included 10 months (August 2012 through May 2013) results of operations of
44