Walgreens 2014 Annual Report Download - page 54
Download and view the complete annual report
Please find page 54 of the 2014 Walgreens annual report below. You can navigate through the pages in the report by either clicking on the pages listed below, or by using the keyword search tool below to find specific information within the annual report.-
 1
1 -
2
-
3
-
4
-
5
-
6
-
7
-
8
-
9
-
10
-
11
-
12
-
13
-
14
-
15
-
16
-
17
-
18
-
19
-
20
-
21
-
22
-
23
-
24
-
25
-
26
-
27
-
28
-
29
-
30
-
31
-
32
-
33
-
34
-
35
-
36
-
37
-
38
-
39
-
40
-
41
-
42
-
43
-
 44
44 -
 45
45 -
 46
46 -
 47
47 -
 48
48 -
 49
49 -
 50
50 -
 51
51 -
 52
52 -
 53
53 -
 54
54 -
 55
55 -
 56
56 -
 57
57 -
 58
58 -
 59
59 -
 60
60 -
 61
61 -
 62
62 -
 63
63 -
 64
64 -
65
-
66
-
67
-
68
-
69
-
70
-
71
-
72
-
73
-
74
-
75
-
76
-
77
-
78
-
79
-
80
-
81
-
82
-
83
-
84
-
85
-
86
-
87
-
88
-
89
-
90
-
91
-
92
-
93
-
94
-
95
-
96
-
97
-
98
-
99
-
100
-
101
-
102
-
103
-
104
-
105
-
106
-
107
-
108
-
109
-
110
-
111
-
112
-
113
-
114
-
115
-
116
-
117
-
118
-
119
-
120
 |
 |

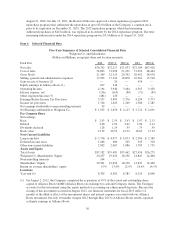
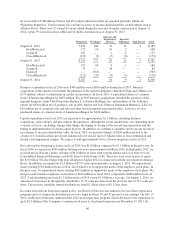
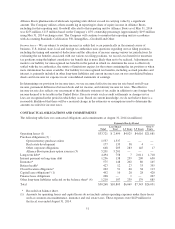
do not include 437 Healthcare Clinics and 48 worksite pharmacies that are operated primarily within our
Walgreens drugstores. Total locations also exclude locations of unconsolidated partially owned entities such as
Alliance Boots. There were 25 owned locations added during the year and 16 under construction at August 31,
2014, versus 39 owned locations added and 41 under construction as of August 31, 2013.
Drugstores Worksites
Infusion and
Respiratory
Services
Specialty
Pharmacy Mail Service Total
August 31, 2012 7,930 366 76 11 2 8,385
New/Relocated 172 14 10 2 — 198
Acquired 147 — 1 4 — 152
Closed/Replaced (133) (9) (5) (6) — (153)
August 31, 2013 8,116 371 82 11 2 8,582
New/Relocated 153 26 4 1 — 184
Acquired 70 — 14 — — 84
Disposed — (365) — — — (365)
Closed/Replaced (132) (32) (9) (3) — (176)
August 31, 2014 8,207 — 91 9 2 8,309
Business acquisitions in fiscal 2014 were $344 million versus $630 million during fiscal 2013. Business
acquisitions in the current year include the purchase of the regional drugstore chain Kerr Drug and affiliates for
$173 million, subject to adjustment in certain circumstances. In fiscal 2014, we purchased shares of common
stock of AmerisourceBergen for $493 million. Fiscal 2013 business acquisitions included the purchase of the
regional drugstore chain USA Drug from Stephen L. LaFrance Holdings, Inc. and members of the LaFrance
family for $436 million net of assumed cash, an 80% interest in Cystic Fibrosis Foundation Pharmacy, LLC for
$29 million net of assumed cash, and selected other assets (primarily prescription files). Last year, we also
purchased shares of common stock of AmerisourceBergen for $224 million.
Capital expenditures for fiscal 2015 are expected to be approximately $1.7 billion, excluding business
acquisitions, joint ventures and prescription file purchases, although the actual amount may vary depending upon
a variety of factors, including, among other things, the timing of closing of the second step transaction and the
timing of implementation of certain capital projects. In addition, we continue to optimize and focus our resources
in a manner to increase shareholder value. In fiscal 2014, we incurred charges of $209 million related to the
closure of 67 retail locations previously announced to be closed, most of which relates to lease termination and
related asset impairment charges. We expect to add approximately 60 to 120 new drugstores in fiscal 2015.
Net cash used by financing activities in fiscal 2014 was $1.6 billion compared to $1.5 billion in the prior year. In
fiscal 2014, we repaid our $550 million floating rate notes upon maturity in March 2014. In September 2012, we
received proceeds from a public offering of $4.0 billion of notes with varying interest rates (see Note 9 to our
Consolidated Financial Statements in Part II, Item 8 of this Form 10-K). The notes were used, in part, to repay
the $3.0 billion 364-day bridge term loan obtained in August 2012 in connection with the investment in Alliance
Boots. In addition, we repaid our $1.3 billion 4.875% notes upon maturity on August 1, 2013. We repurchased
shares totaling $705 million in fiscal 2014, all of which was to support the needs of the employee stock plans. In
the prior year, we repurchased shares totaling $615 million to support the needs of the employee stock plans. We
had proceeds related to employee stock plans of $612 million in fiscal 2014, compared to $486 million in fiscal
2013. Cash dividends paid were $1.2 billion in fiscal 2014 versus $1.0 billion a year ago. On August 5, 2014, we
announced an increase in the quarterly dividend to 33.75 cents per share from the previous rate of 31.5 cents per
share. The increase raised the annual dividend rate from $1.26 per share to $1.35 per share.
In connection with our long-term capital policy, our Board of Directors has authorized several share repurchase
programs and set a long-term dividend payout ratio target between 30 and 35 percent of net earnings. On July 13,
2011, our Board of Directors authorized the 2012 stock repurchase program, which allowed for the repurchase of
up to $2.0 billion of the Company’s common stock prior to its planned expiration on December 15, 2015. In
46